【2.3.2】Control-FREEC检测拷贝数变异
Control-FREEC是一款认可度较高的检测染色体片段拷贝数变异的软件
官方文献为:
- Control-FREEC: a tool for assessing copy number and allelic content using next generation sequencing data. V. Boeva, T. Popova, K. Bleakley, P. Chiche, I. Janoueix-Lerosey, O. Delattre and E. Barillot. Bioinformatics, 2012, 28(3):423-5. PMID: 22155870.
- CNA detection part of Control-FREEC (simply FREEC)
- Control-free calling of copy number alterations in deep-sequencing data using GC-content normalization. V. Boeva, A. Zinovyev, K. Bleakley, J.-P. Vert, I. Janoueix-Lerosey, O. Delattre and E. Barillot. Bioinformatics, 2011, 27(2):268-9. PMID: 21081509. LOH detection part of Control-FREEC
官方manual网址为: http://boevalab.inf.ethz.ch/FREEC/
一、原理
(待有时间补充)
二、安装
软件作者将源码释放在了github,所以可以直接clone
gitclone https://github.com/BoevaLab/FREEC.git
然后进入FREEC文件直接使用,可视化的时候需要安装R包rtracklayer,依赖XML,可以用conda安装,命令为
conda install -c r r-xml=3.98_1.5
此外还需要下载
- 软件自带数据库mapping标签 http://xfer.curie.fr/get/vyIi4w8EONl/out100m2_hg38.zip
- SNP数据http://xfer.curie.fr/get/zVAhyLdWmfo/hg19_snp131.SingleDiNucl.1based.txt
配置文件:
WGS:
[general]
BedGraphOutput=TRUE
bedtools=/usr/bin/bedtools
breakPointThreshold=0.9
breakPointType=2
chrFiles=hg19chromFa#分染色体的参考基因组,可以用gatk配套的
chrLenFile=Data/chr_hg19.len#染色体长度数据,可以用软件自带的Data下面数据
coefficientOfVariation = 0.01
contamination=0
contaminationAdjustment=FALSE
degree=3
forceGCcontentNormalization=0
GCcontentProfile = output/GC_profile.cnp
gemMappabilityFile =Data/out100m2_hg19.gem#bam比对质量的编码对应质量值的表,软件自带
intercept=1
minCNAlength=1
minMappabilityPerWindow=0.85
minExpectedGC=0.35
maxExpectedGC=0.55
minimalSubclonePresence=20
maxThreads=8
noisyData=FALSE
outputDir=output/
ploidy=2
printNA=TRUE
readCountThreshold=10
sambamba=sambamba#提前安装sambaba
SambambaThreads=8
samtools=samtools#提前安装samtools,若没有加入环境变量,则需要写成绝对路径
sex=XX#性别,男为XY,女为XX,在X染色体del或dup的判定时起作用
step=10000#WGS的话步长设为10000
telocentromeric=50000#WGS默认
uniqueMatch=TRUE
window=1000000#与step一起起作用,wes和区间捕获时需要设置更小

[sample]


mateFile=sample.HQ.bam#样本bam

#mateCopyNumberFile = chr_19.noDup0.pileup.gz_sample.cpn

inputFormat=BAM#SAM, BAM, pileup, bowtie, eland, arachne, psl (BLAT), BED, Eland. All formated except BAM are also accepted GZipped.

mateOrientation = FR

#miniPileup


[control]

#无

[BAF]
SNPfile = testChr19/hg19_snp131.SingleDiNucl.1based.txt#下载软件自带
minimalCoveragePerPosition = 1
makePileup=testChr19/hg19_snp131.SingleDiNucl.1based.bed#下载软件自带的正常人数据
fastaFile=database/hg19/refseq/ucsc.hg19.fasta
minimalQualityPerPosition=0
shiftInQuality=33

[target]
#captureRegions=如果是WGS,捕获区间不需要设置
WES:
$cat config.txt
[general]
BedGraphOutput=TRUE
bedtools=/usr/bin/bedtools
breakPointThreshold=0.9
breakPointType=2
chrFiles=hg19chromFa
chrLenFile=~/Software/Control_FREEC/Data/chr_hg19.len
coefficientOfVariation = 0.01
contamination=0
contaminationAdjustment=FALSE
degree=1
forceGCcontentNormalization=1
GCcontentProfile = output/GC_profile.cnp
gemMappabilityFile =~/Software/Control_FREEC/Data/out100m2_hg19.gem
intercept=1
minCNAlength=3
minMappabilityPerWindow=0.85
minExpectedGC=0.35
maxExpectedGC=0.55
minimalSubclonePresence=20
maxThreads=8
noisyData=TRUE
outputDir=output/
ploidy=2
printNA=FALSE
readCountThreshold=50
sambamba=~/Software/Sambamba/sambamba
SambambaThreads=8
samtools=~/miniconda2/bin/samtools
sex=XX
#step=10000 当样品是区间捕获panel或者全外显子捕获时,step不设置
#telocentromeric=50000 同上
uniqueMatch=TRUE
window=0 #全外或者panel数据设为0,因为需要提供bed,不需要像全基因组那样平均地设置窗口


[sample]


mateFile=2_Alignment/result/sample.HQ.bam

#mateCopyNumberFile = chr_19.noDup0.pileup.gz_sample.cpn

inputFormat=BAM#SAM, BAM, pileup, bowtie, eland, arachne, psl (BLAT), BED, Eland. All formated except BAM are also accepted GZipped.

mateOrientation = FR

#miniPileup


[control]

#临床样本无对照

[BAF]

SNPfile =testChr19/hg19_snp131.SingleDiNucl.1based.txt
minimalCoveragePerPosition = 1
makePileup=testChr19/hg19_snp131.SingleDiNucl.1based.bed
fastaFile=~/database/hg19/refseq/ucsc.hg19.fasta
minimalQualityPerPosition=0
shiftInQuality=33

[target]

captureRegions=~/database/hg19/target_region/SureSelect_Human_All_Exon_V5_Regions.bed
二、运行脚本
配置config.txt,然后依次运行以下命令。
#统计样本GC含量
~/Software/Control_FREEC/gccount/gccount -conf config.txt
#Freec跑cnv结果
freec -conf config.txt
#对结果的区间文件进行注释
bedtools intersect -a output/sample.HQ.bam_CNVs -b Database/hg19/all_gene.bed -wa   -wb|  bedtools groupby -i - -g 1-7 -c 11 -o collapse >output/SV_result.xls
#对数据结果可视化,第一步,计算显著性
cat ~/Software/Control_FREEC/FREEC-11.5/scripts/assess_significance.R | R --slave --args sample.HQ.bam_CNVs sample.HQ.bam_ratio.txt
第二步,绘制曼哈顿图
cat ~/Software/Control_FREEC/FREEC-11.5/scripts/makeGraph.R | R --slave --args 2 sample.HQ.bam_ratio.txt sample.HQ.bam_BAF.txt
三、结果解析
(待补充)
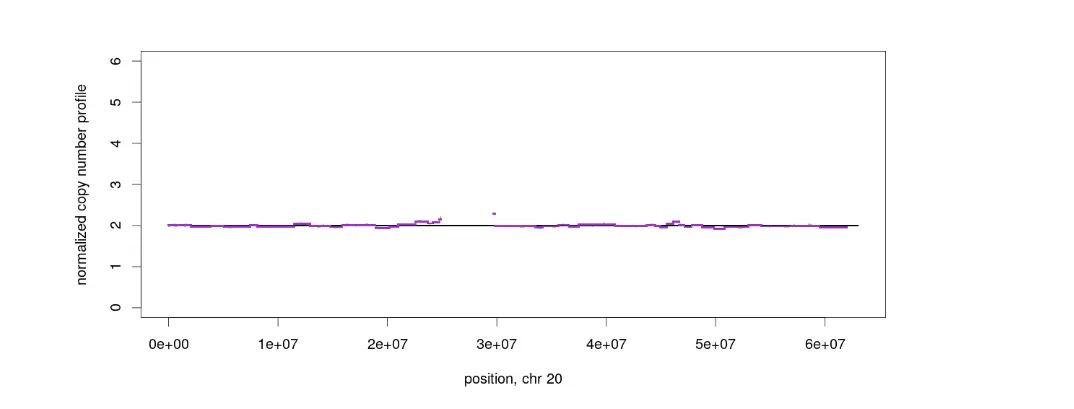
四、可视化结果
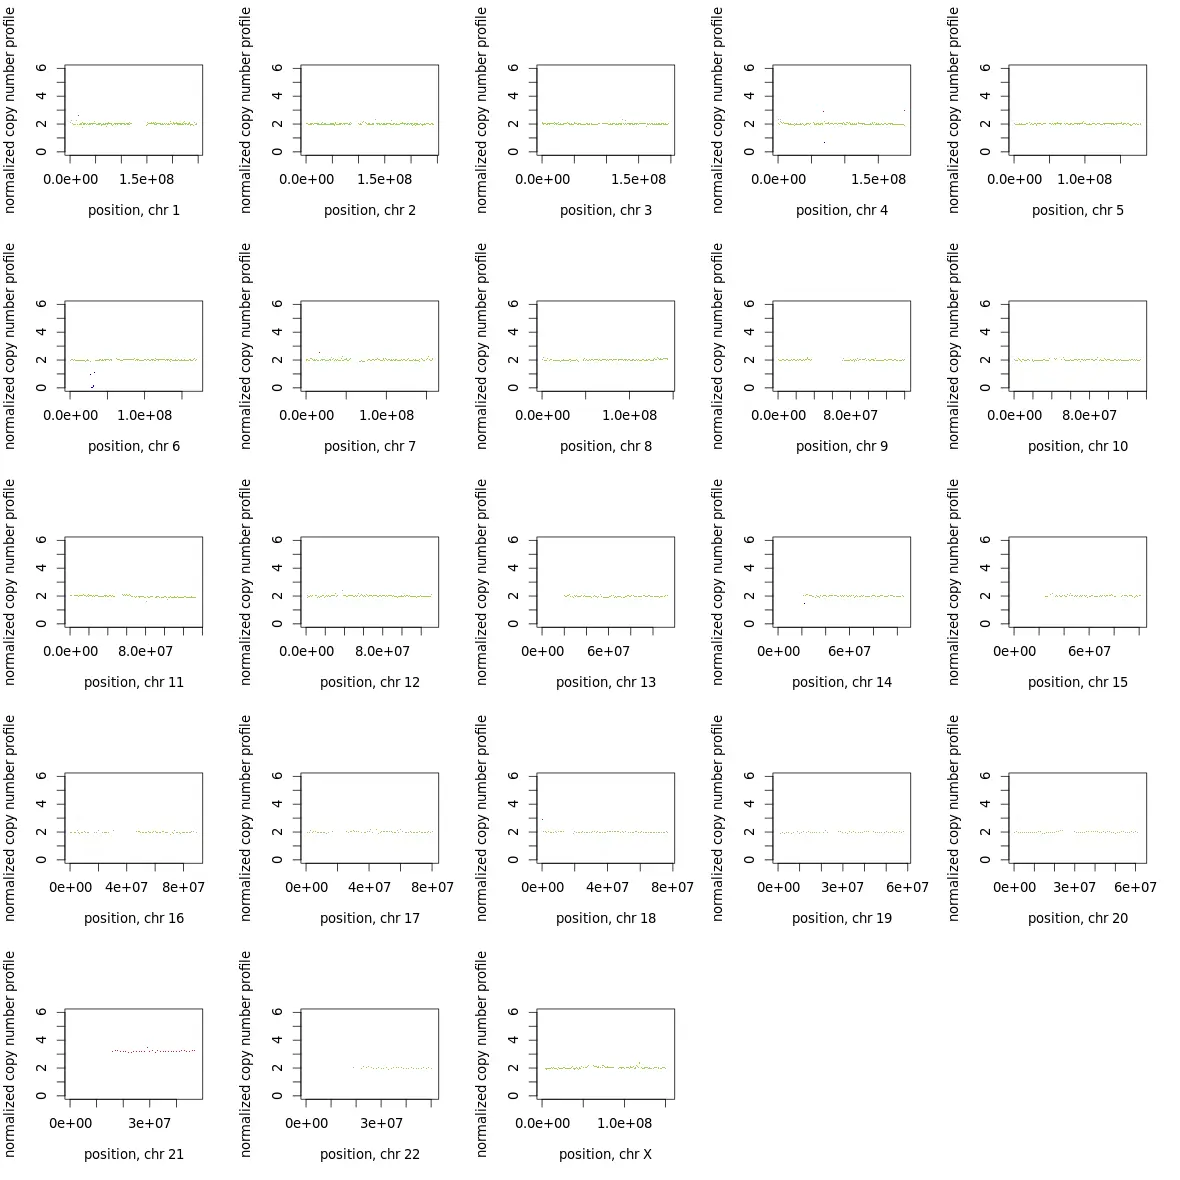
若要取单独的染色体作图,如下图类似,可以通过修改makeGraph.R里的作图函数op <- par(mfrow = c(5,5))改为c(1,1),设计每页的小图数为1,可将所有染色体单独画出。
如图,10XWGS数据分析结果,可以明显看到染色体21出现了异常的三拷贝,并且在整条染色体都有体现。而其他染色体显示正常。通过细胞实验室辅助,验证以上结论。
参考资料
药企,独角兽,苏州。团队长期招人,感兴趣的都可以发邮件聊聊:tiehan@sina.cn
![]() 个人公众号,比较懒,很少更新,可以在上面提问题,如果回复不及时,可发邮件给我: tiehan@sina.cn
个人公众号,比较懒,很少更新,可以在上面提问题,如果回复不及时,可发邮件给我: tiehan@sina.cn
