MultiQC
MultiQC aggregates results from bioinformatics analyses across many samples into a single report. 将fastqc生成的多个报告整合成一个报告,方便查看所有测序数据的质量。
二、用法
(base) [s16@R730 teaching]$ multiqc -h
Usage: multiqc [OPTIONS] <analysis directory>

  MultiQC aggregates results from bioinformatics analyses across many samples into a single report.

  It searches a given directory for analysis logs and compiles a HTML report.
  It's a general use tool, perfect for summarising the output from numerous bioinformatics tools.
  它在给定目录中搜索分析日志并编译HTML报告。
  这是一个通用的工具,完美地总结了从众多输出生物信息学的工具。

  To run, supply with one or more directory to scan for analysis results. To
  run here, use 'multiqc .'

  See http://multiqc.info for more details.

  Author: Phil Ewels (http://phil.ewels.co.uk)

Options:
  #覆盖同名报告
  -f, --force                     Overwrite any existing reports
  #记录绝对路径,默认情况下,记录的格式是:绝对路径和文件名
  -d, --dirs                      Prepend directory to sample names
  #记录一层路径,后跟num,指定记录num层路径;当num为负整数时,则从路径的起始处取
  -dd, --dirs-depth INTEGER       Prepend [INT] directories to sample names.Negative number to take from start of path.
  #保留样本名称
  -s, --fullnames                 Do not clean the sample names (leave as full file name)
  #指定报告标题,没指定则默认使用文件名
  -i, --title TEXT                Report title. Printed as page header, used for filename if not otherwise specified.
  #自定义评论,将打印在报告的顶部
  -b, --comment TEXT              Custom comment, will be printed at the top of the report.
  #更改输出文件的名称
  -n, --filename TEXT             Report filename. Use 'stdout' to print to standard out.
  #指定报告输出路径
  -o, --outdir TEXT               Create report in the specified output
                                  directory.
  #指定报告输出模板,有default|default_dev|geo|sections|simple
  -t, --template [default|default_dev|gathered|geo|sections|simple] Report template to use.
  #只使用这个关键字标记的模块,例如:RNA
  --tag TEXT                      Use only modules which tagged with this keyword, eg. RNA
  #展示可利用的tags
  --view-tags, --view_tags        View the available tags and which modules they load
  #指定的文件、文件夹不进行统计
  -x, --ignore TEXT               Ignore analysis files (glob expression)
  #忽略指定的样本
  --ignore-samples TEXT           Ignore sample names (glob expression)
  #忽略符号链接的目录和文件
  --ignore-symlinks               Ignore symlinked directories and files
  #使用日志文件名作为示例名称
  --fn_as_s_name                  Use the log filename as the sample name
  #在生成报告期间重命名样本名称的TSV文件路径
  --replace-names PATH            Path to TSV file to rename sample names during report generation
  #包含报告中用于重命名按钮的备选示例名称的TSV文件的路径
  --sample-names PATH             Path to TSV file containing alternative  sample names for renaming buttons in the report
  #包含报告显示/隐藏模式的TSV文件的路径
  --sample-filters PATH           Path to TSV file containing show/hide patterns for the report
  #文件每行对应一个文件
  -l, --file-list                 Supply a file containing a list of file paths to be searched, one per row
  #除指定模块,其他模块均运行
  -e, --exclude [module name]     Do not use this module. Can specify multiple times.
  #运行指定模块
  -m, --module [module name]      Use only this module. Can specify multiple times.
  #生成指定的data目录
  --data-dir                      Force the parsed data directory to be created.
  #指定不生成data目录
  --no-data-dir                   Prevent the parsed data directory from being created.
  #解析数据目录,默认格式是:tsv; 此参数主要针对有大量样本需要处理
  -k, --data-format [tsv|json|yaml]
                                  Output parsed data in a different format.
                                  Default: tsv
  #压缩data目录
  -z, --zip-data-dir              Compress the data directory.
  #不生成报告,只生成data目录和图
  --no-report                     Do not generate a report, only export data
                                  and plots
  #除报告外,还将图表导出为静态图像
  -p, --export                    Export plots as static images in addition to the report
  #只使用平面图(静态图)
  -fp, --flat                     Use only flat plots (static images)
  #只使用交互式图表(HighCharts Javascript)
  -ip, --interactive              Use only interactive plots (HighCharts Javascript)
  #使用严格的检测(验证)来帮助编写代码
  --lint                          Use strict linting (validation) to help code development
  #要输出pdf版本报告必须先安装Pandoc
  #指定输出文件是PDF文件,默认输出是HTML文件,此参数需搭配参数-t simple, 且pandoc模块必须存在,否则无法生成pdf
  --pdf                           Creates PDF report with 'simple' template.
                                  Requires Pandoc to be installed.
  #不将生成的报告上传到MegaQC,即使发现了MegaQC选项
  --no-megaqc-upload              Don't upload generated report to MegaQC, even if MegaQC options are found
  #需要加载的特定配置文件,位于MultiQC dir / home dir / working dir目录中的配置文件之后。
  -c, --config PATH               Specific config file to load, after those in MultiQC dir / home dir / working dir.
  #在命令行上指定MultiQC配置YAML
  --cl-config, --cl_config TEXT   Specify MultiQC config YAML on the command line
  #当存在两个同名的文件时,增加此参数可以区别两者,避免前者的数据被后者所覆盖
  -v, --verbose                   Increase output verbosity.
  #只显示日志警告
  -q, --quiet                     Only show log warnings
  #在报告中添加MultiQC运行所需时间的分析
  --profile-runtime               Add analysis of how long MultiQC takes to run to the report
  #禁用彩色日志输出
  --no-ansi                       Disable coloured log output
  #自定义CSS文件添加到最终的报告
  --custom-css-file PATH          Custom CSS file to add to the final report
  #查看版本
  --version                       Show the version and exit.
  #查看帮助文档
  -h, --help                      Show this message and exit.
三、示范
(base) [s16@R730 teaching]$ multiqc demo.rna_1_fastqc.zip demo.rna_2_fastqc.zip

  /// MultiQC 🔍 | v1.12

|           multiqc | Search path : /home/s16/data/teaching/demo.rna_1_fastqc.zip
|           multiqc | Search path : /home/s16/data/teaching/demo.rna_2_fastqc.zip
|         searching | ━━━━━━━━━━━━━━━━━━━━━━━━━━━━━━━━━━━━━━━━ 100% 2/2
|            fastqc | Found 2 reports
|           multiqc | Compressing plot data
|           multiqc | Report      : multiqc_report.html
|           multiqc | Data        : multiqc_data
|           multiqc | MultiQC complete
运行完成后生成了一个:multiqc_report.html文件;一个multiqc_data目录
四、MultiQC报告内容解析
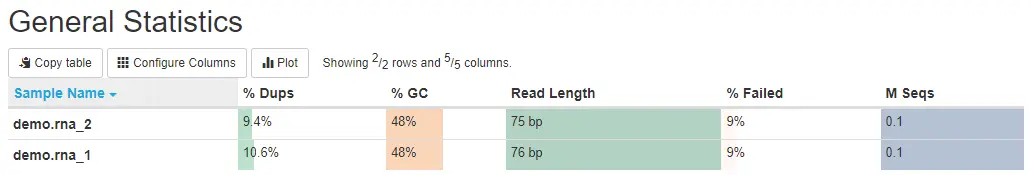
4.1 General Statistics
- %Dups:重复reads的比例 *%GC:GC含量占总碱基的比例 *Length:测序长度 *M seqs:总测序量(单位:millions)
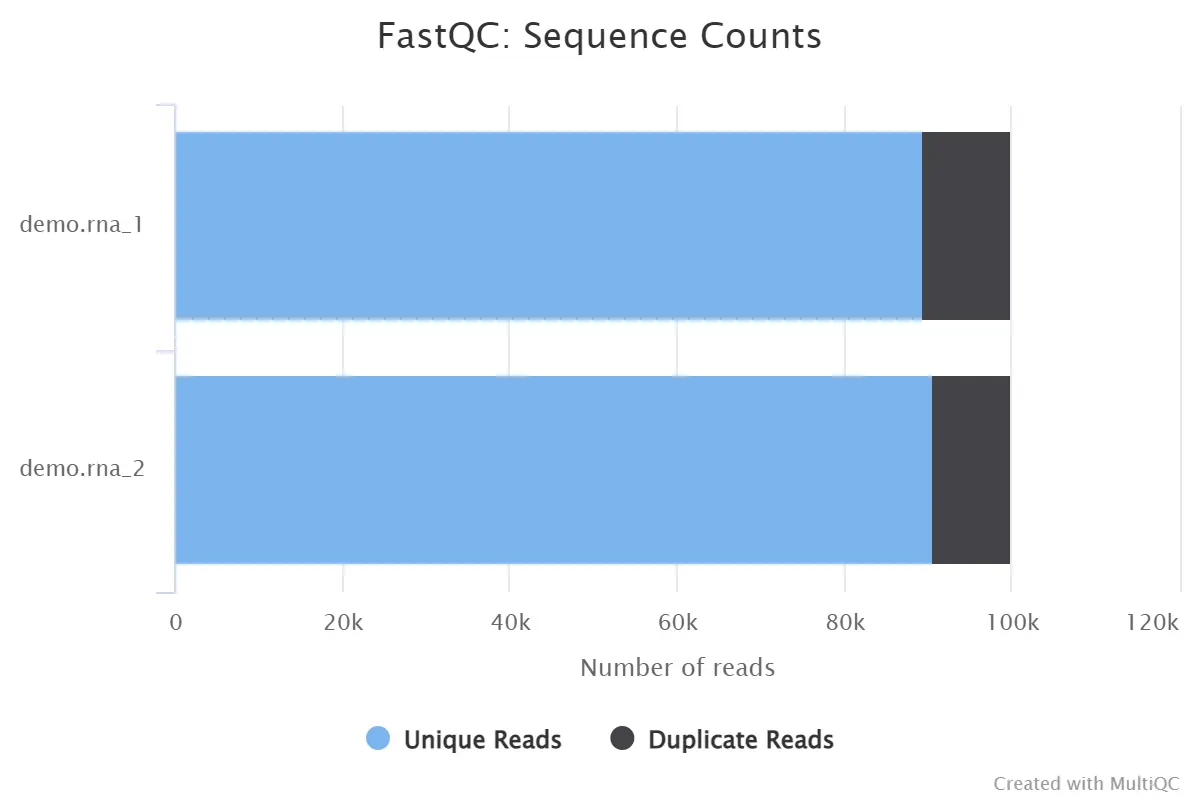
4.2 Sequence Counts
横坐标:reads的数量;纵坐标:样本
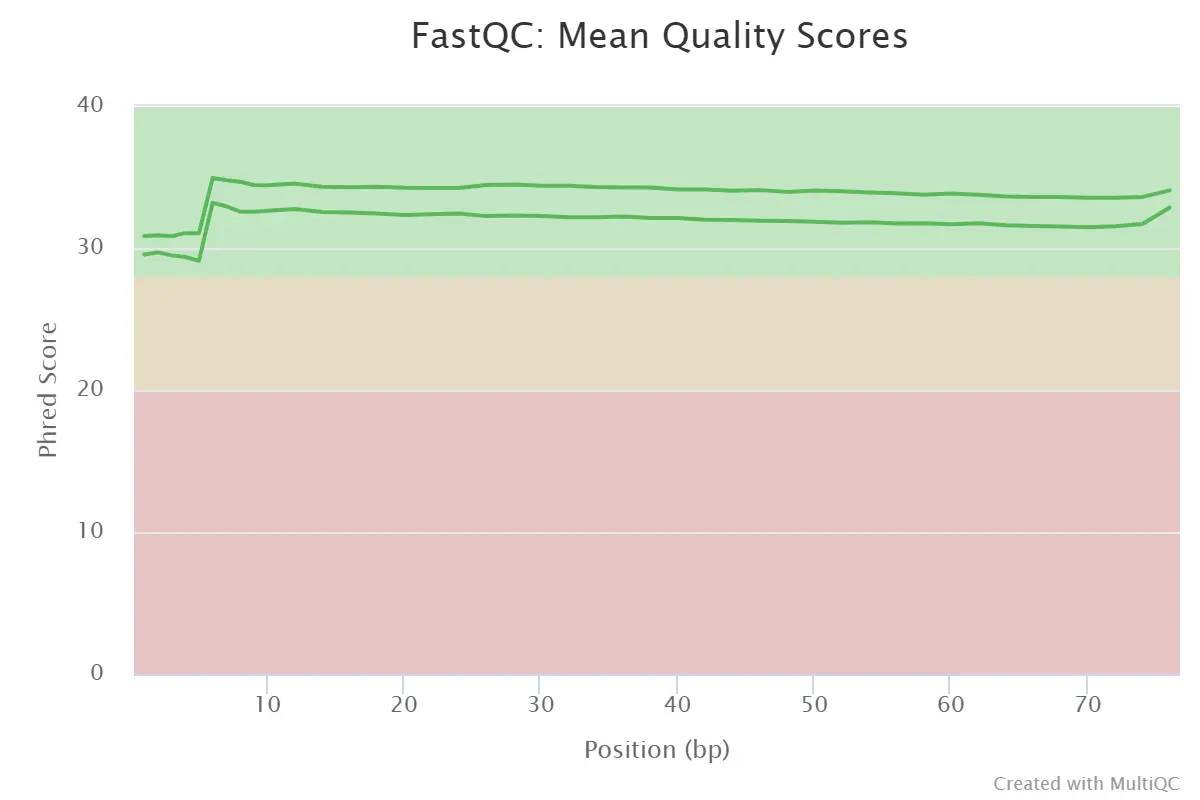
4.3、Sequence Quality Histograms
- reads中平均每个碱基位置的质量值
- 横坐标:碱基位置;纵坐标:质量分数;
- 质量分数为-10log10P(P代表错误率),质量分数为40的时候,p就是0.0001,说明测序质量非常好。
- 绿色区间(Q30-Q40):质量很好,
- 橙色区间(>Q20):质量合格;
- 红色区间(<Q20):质量不好。
Sequence Quality Histograms
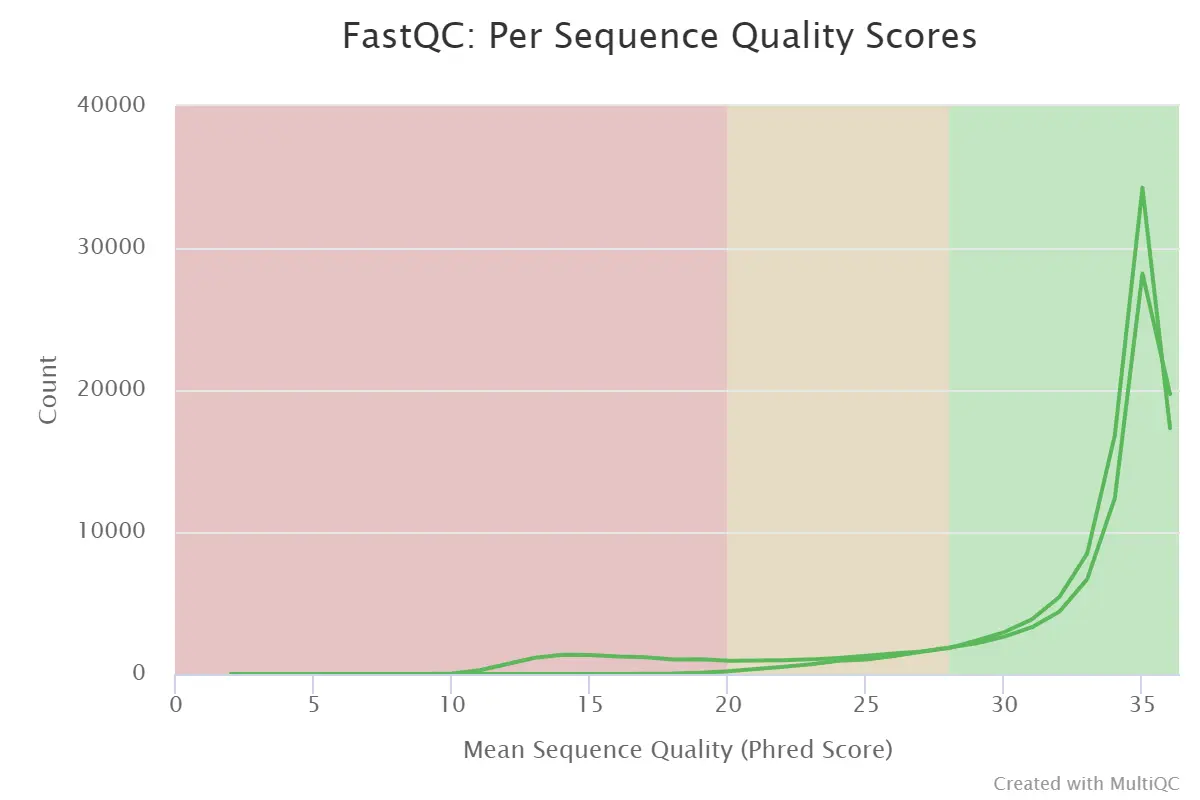
4.4、Per Sequence Quality Scores
序列平均质量分数与reads数的统计
- 横坐标:平均序列质量分数;纵坐标:reads数
- 绿色区间:质量很好;
- 橙色区间:质量合格;
- 红色区间:质量不好;
- 当峰值小于27时:warning;
- 当峰值小于20时:fail。
Per Sequence Quality Scores
4.5、Per Base Sequence Content
每个read各位置碱基ATCG的比列
- 对所有reads的每一个位置,统计ATCG四种碱基的分布
- 横坐标:碱基位置;纵坐标——样本;
- %T——红色;%C——蓝色;%A——绿色,%G——紫色;
- reads每个位置的颜色显示由4种颜色的比例混合而成,哪一个碱基的比例大,则趋近于这个碱基所代表的颜色;
- 正常情况下每个位置每种碱基出现的概率是相近的;
- 如果ATGC在任何位置的差值大于10%:warning;
- 如果ATGC在任何位置的差值大于20%:fail。
【此处的GC分布有波动的reads碱基长度要在trim过程中去除:HEADCROP:12】
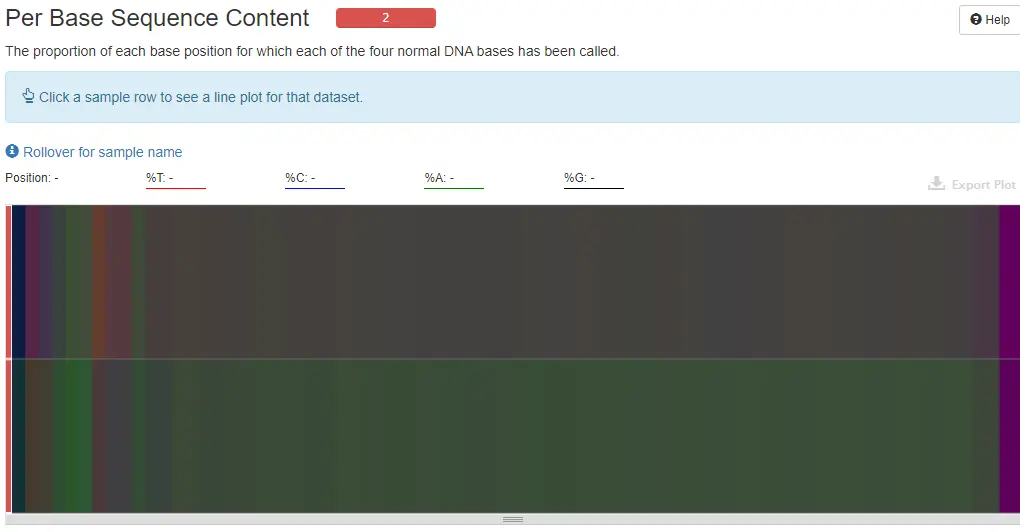
Per Base Sequence Content
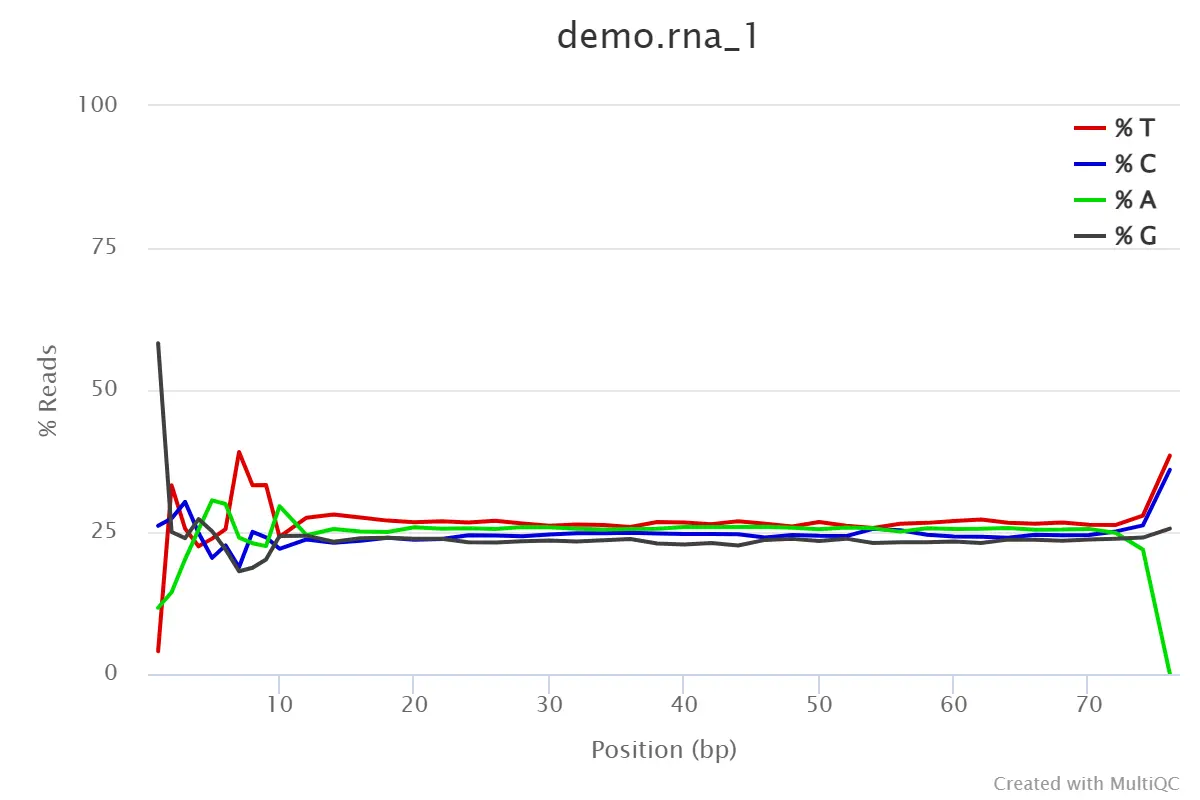
demo_rna_1
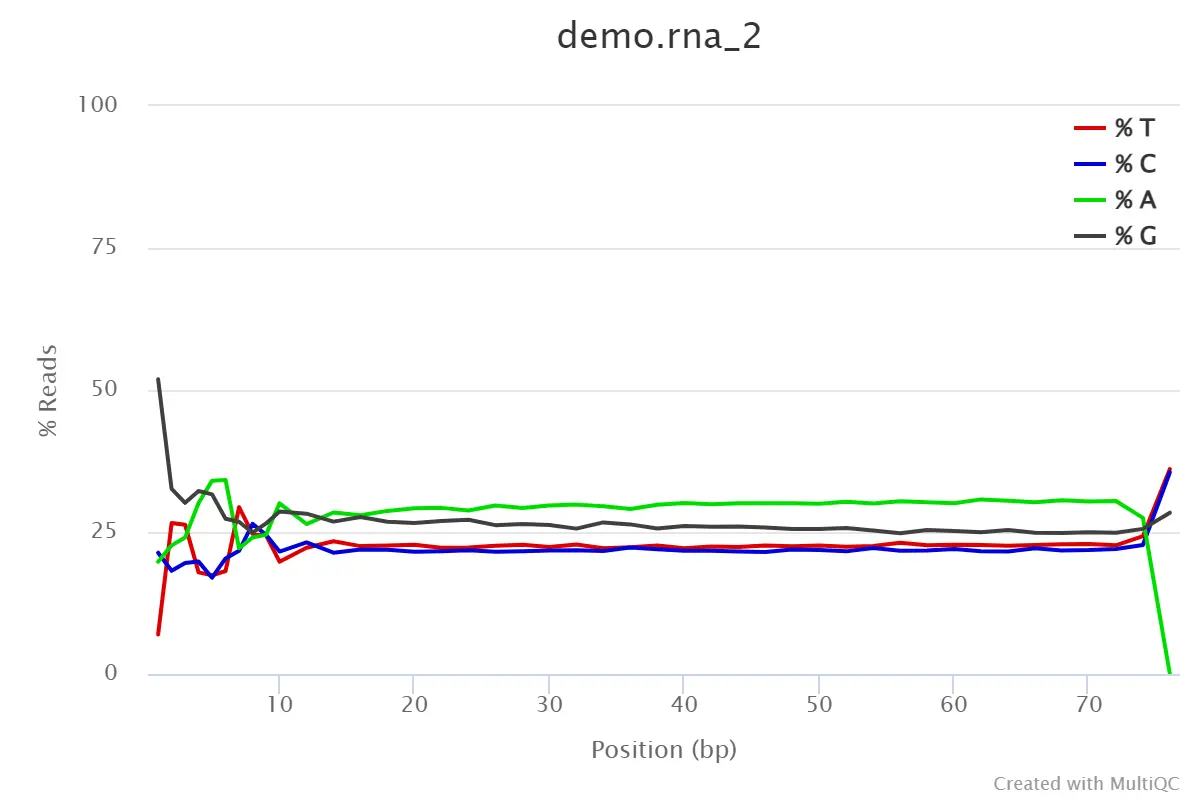
demo_rna_2
4.6、Per Sequence GC Content
reads的平均GC含量
- 横坐标:GC含量百分比;纵坐标:数量
- 正常的样本的GC含量曲线会趋近于正态分布曲线,曲线形状的偏差往往是由于文库的污染或是部分reads构成的子集有偏差(overrepresented reads)。形状接近正态但偏离理论分布的情况提示我们可能有系统偏差。
- 偏离理论分布的reads超过15%时:warning。
- 偏离理论分布的reads超过30%时:fail。
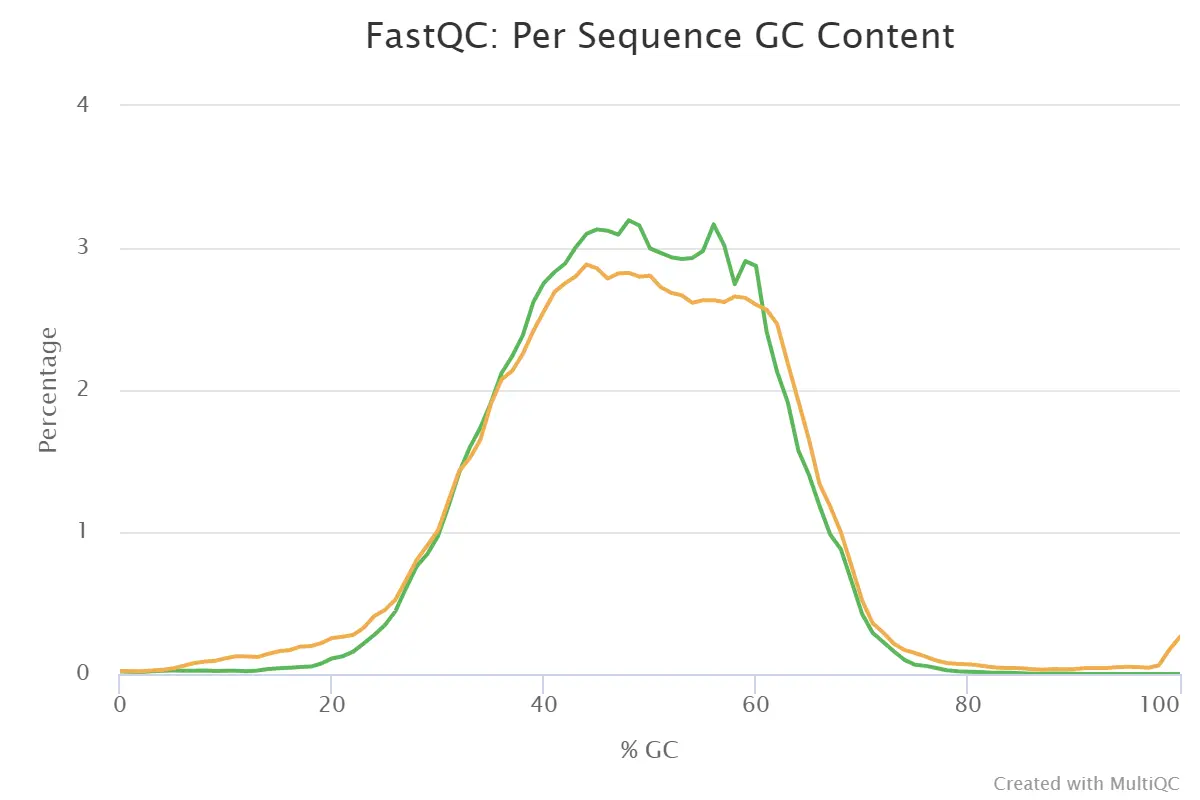
Per Sequence GC Content
4.7、Per Base N Content
每个reads碱基位置N的含量
- 当测序仪器不能辨别某条reads的某个位置到底是什么碱基时,就会产生“N”,统计N的比率。正常情况下,N值非常小。
- 横坐标:read中的位置;纵坐标:N的数量比;
- 当任意位置的N的比例超过5%:warning;
- 当任意位置的N的比例超过20%:fail。
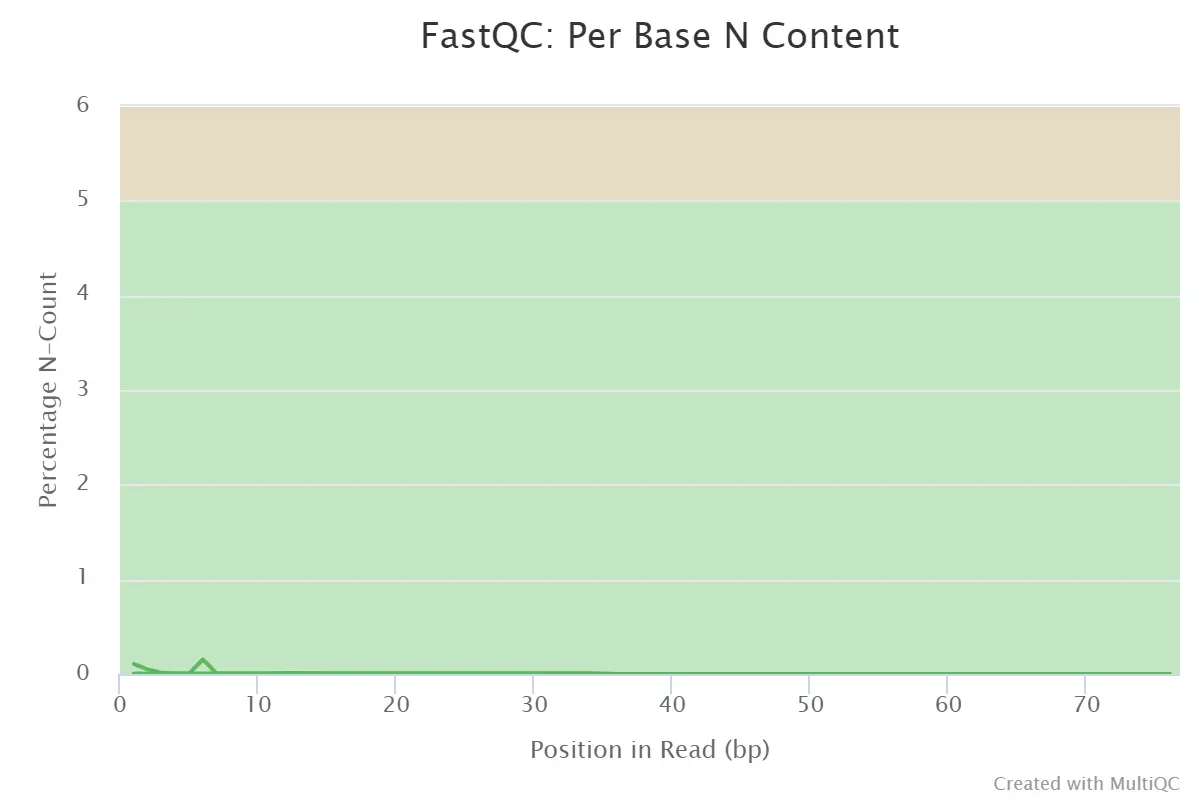
Per Base N Content
4.8、Sequence Length Distribution
序列长度分布
- 横坐标:序列长度(bp);纵坐标:reads数量
- 序列长度越长的reads数越多越好
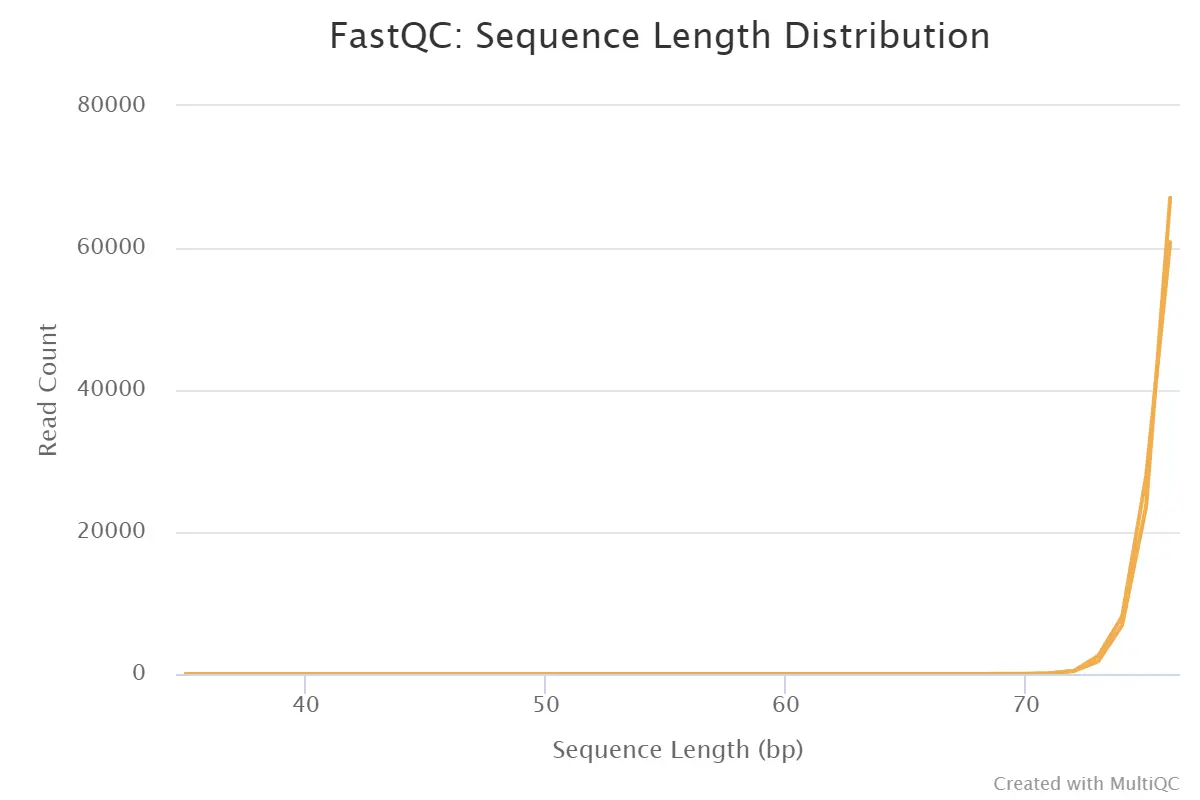
Sequence Length Distribution
4.9、Sequence Duplication Levels
每个序列的相对重复水平
- 横坐标:每个序列的相对重复水平;纵坐标:在文库中的比例
- 当非unique的reads占总数的比例大于20%时:warning;
- 当非unique的reads占总数的比例大于50%时:fail。
- 测序深度越高,越容易产生一定程度的duplication,这是正常的现象,但如果duplication的程度很高,就提示我们可能有bias的存在。
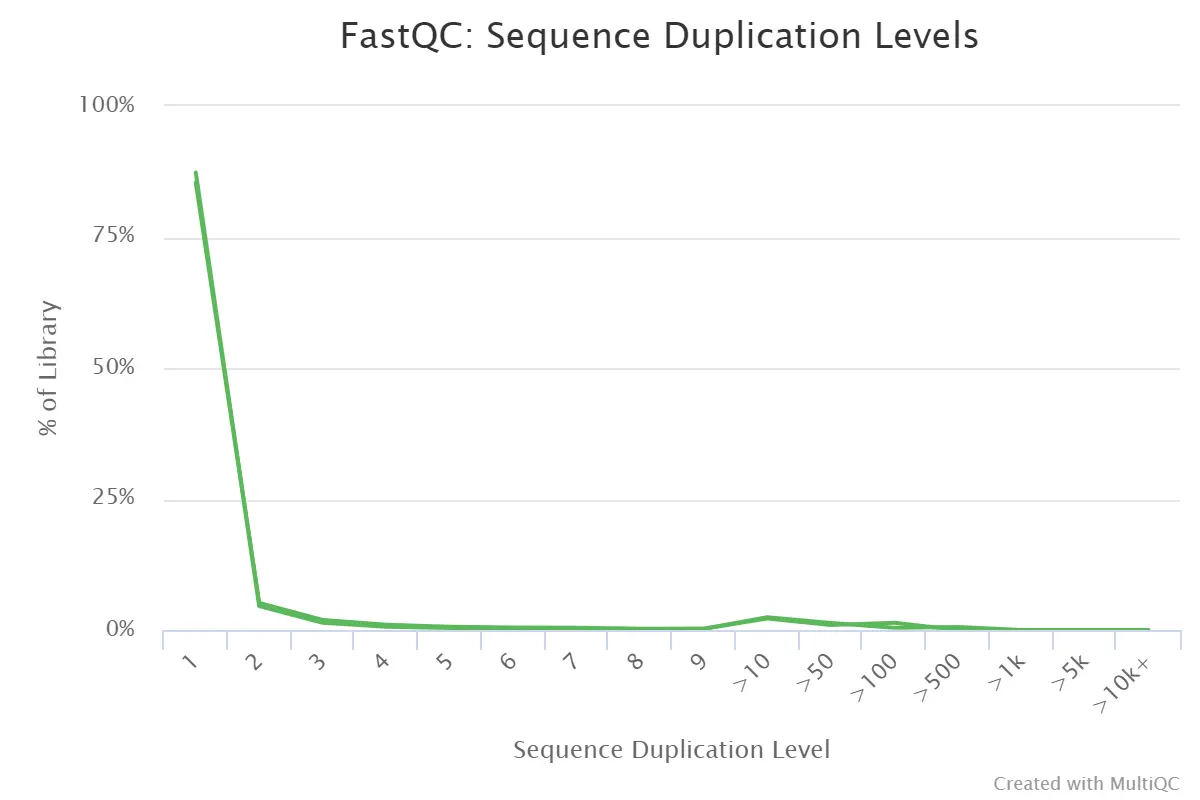
Sequence Duplication Levels
4.10、Overrepresented sequences
文库中过表达序列的比例
- 横坐标:过表达序列的比例;纵坐标:样本
- 过表达序列的比例>0.1%:warning
- 过表达序列的比例>1%:fail。
- 一条序列的重复数,因为一个转录组中有非常多的转录本,一条序列再怎么多也不太会占整个转录组的一小部分(比如1%),如果出现这种情况,不是这种转录本巨量表达,就是样品被污染。这个模块列出来大于全部转录组1%的reads序列,但是因为用的是前100,000条reads,所以其实参考意义不大
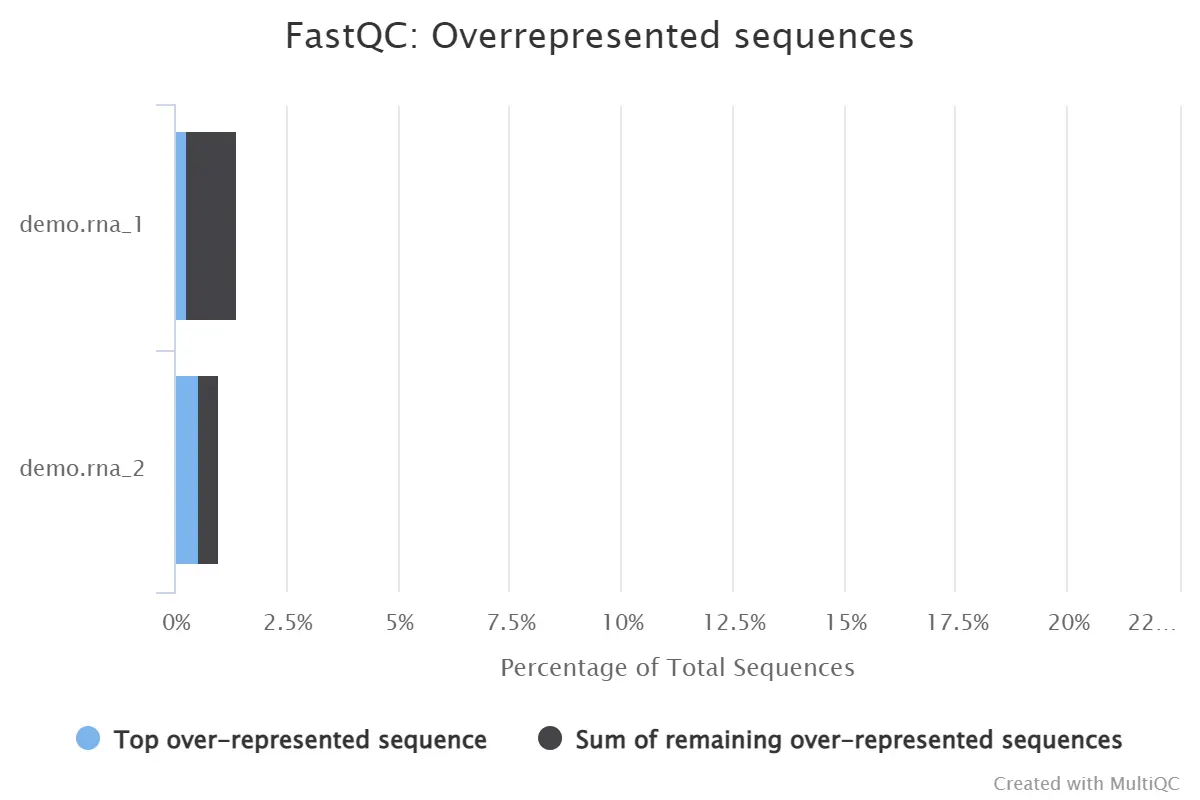
Overrepresented sequences
4.11、Adapter Content
接头含量
- 横坐标:碱基位置;纵坐标:占序列的百分比
-
5%:warning;>10%:fail
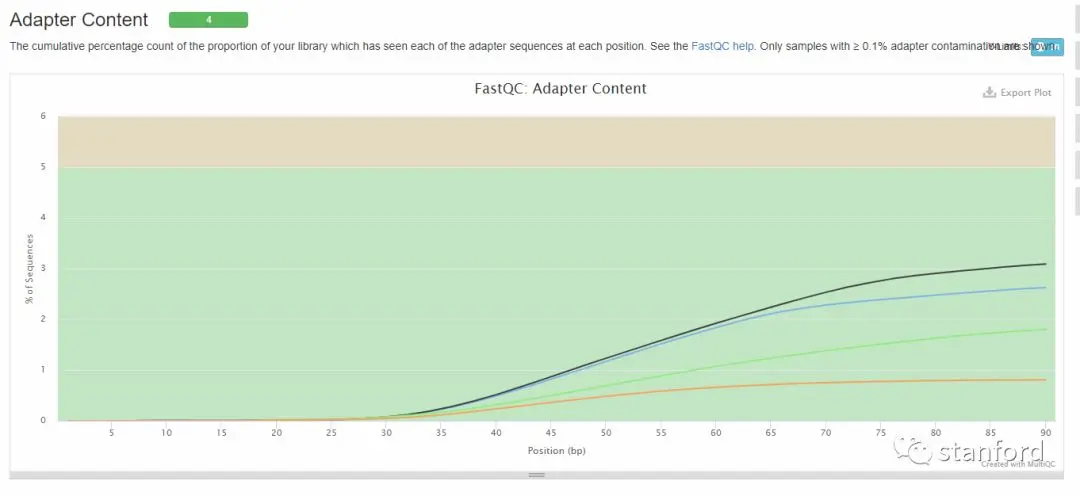
Adapter Content
4.12、Status Checks
状态检查,对以上11个项目的好坏做一个整体的评估:
- 正常(绿色);轻微异常(橙色);非常异常(红色)
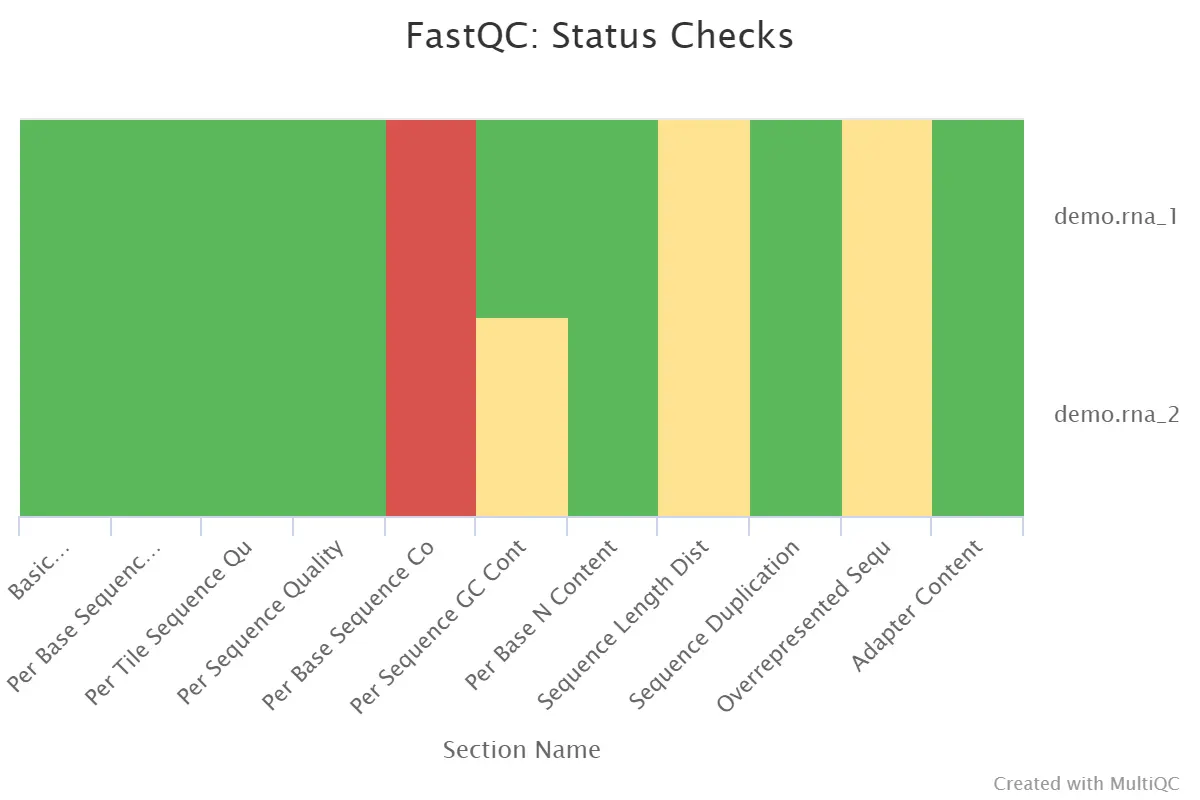
Status Checks
参考资料
药企,独角兽,苏州。团队长期招人,感兴趣的都可以发邮件聊聊:tiehan@sina.cn
![]() 个人公众号,比较懒,很少更新,可以在上面提问题,如果回复不及时,可发邮件给我: tiehan@sina.cn
个人公众号,比较懒,很少更新,可以在上面提问题,如果回复不及时,可发邮件给我: tiehan@sina.cn
