【2.1.2】带边界的气泡图(Bubble plot with Encircling)
有时,希望在边界内显示一组点以强调其重要性。 在此示例中,您将从应该被环绕的数据帧中获取记录,并将其传递给下面代码中描述的encircle()。
一、案例

from matplotlib import patches
from scipy.spatial import ConvexHull
import warnings; warnings.simplefilter('ignore')
sns.set_style("white")

# Step 1: Prepare Data
midwest = pd.read_csv("https://raw.githubusercontent.com/selva86/datasets/master/midwest_filter.csv")

# As many colors as there are unique midwest['category']
categories = np.unique(midwest['category'])
colors = [plt.cm.tab10(i/float(len(categories)-1)) for i in range(len(categories))]

# Step 2: Draw Scatterplot with unique color for each category
fig = plt.figure(figsize=(16, 10), dpi= 80, facecolor='w', edgecolor='k')

for i, category in enumerate(categories):
    plt.scatter('area', 'poptotal', data=midwest.loc[midwest.category==category, :], s='dot_size', c=colors[i], label=str(category), edgecolors='black', linewidths=.5)

# Step 3: Encircling
# https://stackoverflow.com/questions/44575681/how-do-i-encircle-different-data-sets-in-scatter-plot
def encircle(x,y, ax=None, **kw):
    if not ax: ax=plt.gca()
    p = np.c_[x,y]
    hull = ConvexHull(p)
    poly = plt.Polygon(p[hull.vertices,:], **kw)
    ax.add_patch(poly)

# Select data to be encircled
midwest_encircle_data = midwest.loc[midwest.state=='IN', :]

# Draw polygon surrounding vertices
encircle(midwest_encircle_data.area, midwest_encircle_data.poptotal, ec="k", fc="gold", alpha=0.1)
encircle(midwest_encircle_data.area, midwest_encircle_data.poptotal, ec="firebrick", fc="none", linewidth=1.5)

# Step 4: Decorations
plt.gca().set(xlim=(0.0, 0.1), ylim=(0, 90000),
              xlabel='Area', ylabel='Population')

plt.xticks(fontsize=12); plt.yticks(fontsize=12)
plt.title("Bubble Plot with Encircling", fontsize=22)
plt.legend(fontsize=12)
plt.show()
二、案例解读
2.1 确定边界
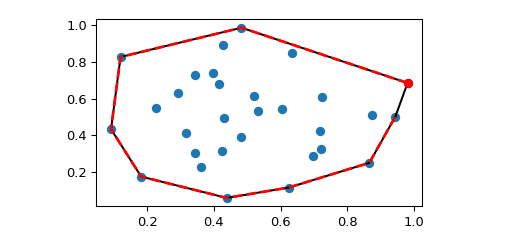
from scipy.spatial import ConvexHull, convex_hull_plot_2d
points = np.random.rand(30, 2)   # 30 random points in 2-D
hull = ConvexHull(points)
print hull


import matplotlib.pyplot as plt
plt.plot(points[:,0], points[:,1], 'o')

for simplex in hull.simplices:
    print simplex,points[simplex, 0]
    plt.plot(points[simplex, 0], points[simplex, 1], 'k-')


plt.plot(points[hull.vertices,0], points[hull.vertices,1], 'r--', lw=2)
plt.plot(points[hull.vertices[0],0], points[hull.vertices[0],1], 'ro')
plt.show()
含义示范:
print simplex,points[simplex, 0]

[20 17] [0.22706164 0.00547213]
[20 29] [0.22706164 0.69636975]
...
[27  4] [0.25261135 0.1616203 ]
[27  8] [0.25261135 0.55498599]

print points

[[0.75991856 0.83036497]
 [0.83861989 0.72823694]
 ...
 [0.29919865 0.55682239]
 [0.25261135 0.86871164]
 [0.16625568 0.41353741]
 [0.69636975 0.03329878]]

print hull.simplices

[[20 17]
 [20 29]
 [21 29]
 [15 17]
 [15  4]
 [22 11]
 [22 21]
 [ 0 11]
 [ 0  8]
 [27  4]
 [27  8]]

print hull.vertices
[17 20 29 21 22 11  0  8 27  4 15]
解读:
- hull.vertices是确定为边界的一个point的在数据List中的位置
- hull.simplices是外边界两两紧挨着的点的hull.vertices
- 更多解读,以后用的时候再来补充
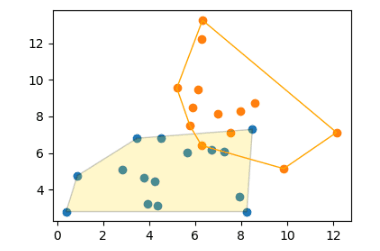
2.2 关于enricle
import matplotlib.pyplot as plt
import numpy as np; np.random.seed(1)
from scipy.spatial import ConvexHull

x1, y1 = np.random.normal(loc=5, scale=2, size=(2,15))
x2, y2 = np.random.normal(loc=8, scale=2.5, size=(2,13))

plt.scatter(x1, y1)
plt.scatter(x2, y2)

def encircle(x,y, ax=None, **kw):
    if not ax: ax=plt.gca()
    p = np.c_[x,y]
    hull = ConvexHull(p)
    poly = plt.Polygon(p[hull.vertices,:], **kw)
    ax.add_patch(poly)

encircle(x1, y1, ec="k", fc="gold", alpha=0.2)
encircle(x2, y2, ec="orange", fc="none")

plt.show()
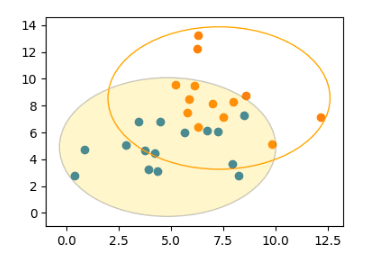
还可以选择是围绕点云的平均值绘制一个圆。
import matplotlib.pyplot as plt
import numpy as np; np.random.seed(1)
from scipy.spatial import ConvexHull

x1, y1 = np.random.normal(loc=5, scale=2, size=(2,15))
x2, y2 = np.random.normal(loc=8, scale=2.5, size=(2,13))

plt.scatter(x1, y1)
plt.scatter(x2, y2)


def encircle2(x,y, ax=None, **kw):
    if not ax: ax=plt.gca()
    p = np.c_[x,y]
    mean = np.mean(p, axis=0)
    d = p-mean
    r = np.max(np.sqrt(d[:,0]**2+d[:,1]**2 ))
    circ = plt.Circle(mean, radius=1.05*r,**kw)
    ax.add_patch(circ)

encircle2(x1, y1, ec="k", fc="gold", alpha=0.2)
encircle2(x2, y2, ec="orange", fc="none")

plt.gca().relim()
plt.gca().autoscale_view()
plt.show()
参考资料
药企,独角兽,苏州。团队长期招人,感兴趣的都可以发邮件聊聊:tiehan@sina.cn
![]() 个人公众号,比较懒,很少更新,可以在上面提问题,如果回复不及时,可发邮件给我: tiehan@sina.cn
个人公众号,比较懒,很少更新,可以在上面提问题,如果回复不及时,可发邮件给我: tiehan@sina.cn
