【2.1】ggplot--条形图(geom_bar)
今天先整理一下我们常用的条形图吧
更多阅读: http://www.bbioo.com/experiment/105-135189-1.html
Plotting means and error bars http://www.cookbook-r.com/Graphs/Plotting_means_and_error_bars_(ggplot2)/
一、实例1.
a<-c("m","n","mn");
b<-c(1,2,3);
c<-c(4,6,7);
abc<-data.frame(a,b,c);
abc;
  a b c
1 a 1 4
2 b 2 6
3 c 3 7
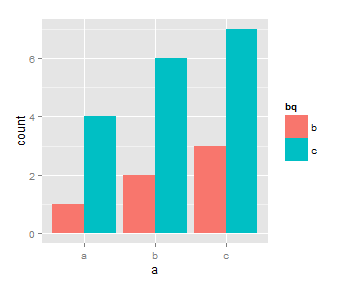
ggplot不识别一个x点对应两个y点,所以需要将后面的两列放在一起,同时每一列加一个标签,这样才可以做出以a为x轴,b,c为y轴的条形图。
第一步:对数据变形
将准备作为x(或者Y)轴的数据的数据放到一起,同时同来自不同样的y轴做上标记
方法一:手动提取,然后用rbind合并
ab<-abc[,c(1,2)];
ab$haha<-rep(“bj”,times=3);
colnames(ab)<-c(“name”,”shuju”,”bq”);

Error: unexpected input in "ab$haha<-rep(?
报错原因:引号为中文引号

ac<-abc[,c(1,3)];
ac$haha<-rep(“sh”,times=3);
colnames(ac)<-c("name","shuju","bq");
agcd<-rbind(ab,ac)ggplot(abcab,aes(name,weight=shuju,fill=bq))+geom_baposition="dodge");
方法二:用reshape2中的melt函数
library(reshape2);
agcd<-melt(abc,id.vars="a",value.name="value",variable.name="bq");
melt
melt(data, id.vars, measure.vars,variable.name = "variable",
 ..., na.rm = FALSE,value.name = "value")
其中 id.vars 是被当做维度的列变量,每个变量在结果中占一列;measure.vars 是被当成观测值的列变量,它们的列变量名称和值分别组成 variable 和value两列,列变量名称用variable.name 和 value.name来指
第二步:作
ggplot(agc,aes(a,weight=value,fill=bq))+geom_bar(position="dodge" `fill 堆叠元素,并标准化为1;dodge避免重叠;identity不做任何调整;jitter给点添加扰动免重合;stack将图形元素堆叠起来
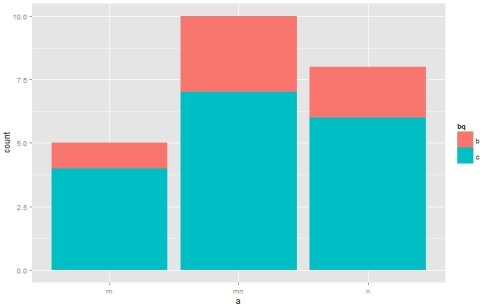
ggplot(agcd,aes(a,weight=value,fill=bq))+geom_bar(position="stack")
二、实例二
1.标签的颜与条形的颜色顺序一致性
可以加入Order命令
library(plyr) ggplot(agcd,es(a,weight=value,fill=bq))+geom_bar(position="stack",aes(order=dsc(bq)));
2.
library(RColorBrewer	newpalette<-olorRampPalette(brewer.pal(12,"Set3"))(length(unque(eee$name)));
p+scale_fill_manuavalues=newpalette);
例如
!geom_bar3](/img/2016/09/geom_bar3.jpeg)
lirary(RColorBrwer);newpalette<-colorRampPalette(brewer.pal(12,"Set3")length(unique(eeame)))
library(grid);
librarylyr);
tiff(filename="bac_geus.tiff",width=20,height=18,units="cm",compression="lzw",g="whitres=600);
ggplot(eee,aes(bq,weight=value,fill=name))
	+geobar(position"stack",aes(order=desc(name))
	+theme(legend.title=element_blank())+ylab("丰度")+xlab("样品")
	+scale_fill_mnual(values=newpalette)

	+thme(panel.backround=element_rect(fill=NA,colour="grey"),	axis.text.x=element_tex t(size=15),axis.text.x=element_text(size=15),
	axis.title.xelement_text(size=20),axis.title.y=element_text(size=20),
	legend.key.height=unit(0.5,"cm"),legend.text=element_text(size=8));
dev.ff
这里面包含
- 签颜色的修改以及标签排序与作图排序的一致
- 根据样品的个数,修改了Legend的长度,以及其他字体的颜色
按照数值大小作图,以及旋转x轴的标
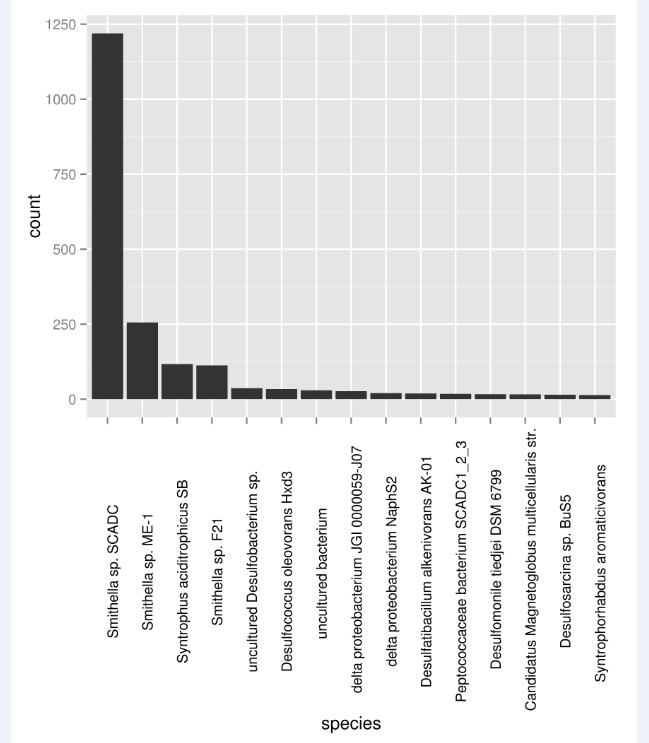
tiff(filename="species.tiff",width=15,height=18,units="cm",compression="lzw",bg="white",res=600	ggplot(spp)+geom_bar(aes(reorder(sp,-num),weight=num))+theme(axis.text.x=element_text(angle=90,colour="black"));
dev.off
旋转
用的
theme(xis.text.x=element_text(angle=90,colour="black")
按值来排画图的顺序
reorer(sp,-num)
实
文件arc_genus.txt
order        genus       abundance       category
Acidilobales      Caldisphaera   0.44275775      DSZ


Halobacteriales        Halalkalicoccus         0.75901328      DSZ
Halobacteriales        Halococcus       0.44275775      DSZ
Hlobacteriales        Halolamina       0.06325111      DSZ	Halobacteriales        Halorubrum     0.06325111      DSZ
Fervidicoccales         Fervidicoccus   1.13851992      DSZ
Methanobacteriales        Methanobacterium 0.06325111      DSZ
Manobacteriales        Methanobrevibacter        0.18975332      DSZ
Methanobacteriales        Methanosphaera     0       DSZ
ethanomicrobiales Methanoregula 0 DSZMethanomicrobiales Methanocalculus 0 DSZ Methanomicrobiales Methanogenium 0.12650221 DSZ Methanosarcinales Methanosaeta 34.59835547 DSZ Methanomicrobiales Methanolobus 27.83048703 DSZ
Mehanomicrobiales        Methanosarcina      4.93358634      DSZ
Acidilobales      Caldisphaera   0       W
Halobacteriales        Halalkalicoccus         11.6477273      WS
Hlobacteriales        Halococcus       0       WS
Halobacteriales        Halolamina       0       WS
Halobacteriales        Halorubrum     0       WS
ervidicoccales         Fervidicoccus   0       WS
Methanobacteriales        Methanobacterium 0.7102273        WS

Methanobacteriales        Methanobrevibacter        0.1420455        WS
Methanobacteriales        Methanosphaera     0.1420455        WSMethanomicrobiales        Methanoregula       0.1420455        WS
Mthanomicrobiales        Methanocalculus     0.1420455        WS
Methanomicrobiales        Methanogenium      0       WS
Methanosarcinales Methanosaeta         4.4318182      WS
Methanomicrobiales        Methanolobus 7.5284091        WS
Methanomicrobiales        Methanosarcina      0.5681818        WS
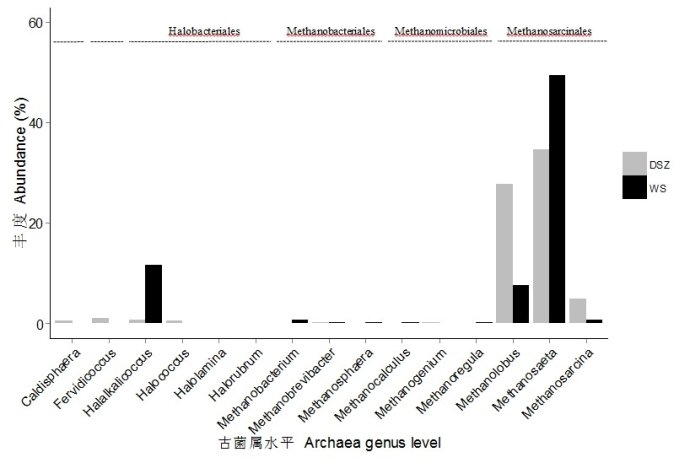
2 命令行
ab<-read.csv("arc_genus.txt",header=T,sep="\t");
library(plyr);ibrary(ggplot2);
注意x,y轴坐标的大小,怎么好看,怎么来
ggplot(ab,aes(reorder(genus,as.numeric(order)),weight=abundance,fill=category))
+geom_bar(position="dodge",aes(order=desc(category)))   +them(panebackground=element_blank(),panel.grid.minor=element_blank(),
axis.line=element_line(size=0.5),legend.title=element_blank())
+theme(axis.text.x=element_text(angle=45,colour="black",size=13,hjust=1))
+theme(axis.text.y=element_text(colour="black",size=13))    +scale_fill_manual(vales=c("grey","black"))

+xlab("古菌属水平  Archaea genus level")+ylab("丰 度  Abundance (%)")    +theme(axis.title.x=element_text(size=15),axis.title.y=element_text(size=15))   +ylim(0,0)
3 命令详解:
去掉背景与图注的标
theme(panelbackground=element_blank(),panel.grid.minor=element_blank(),

axis.line=element_line(size=0.5),legend.title=element_blank())
调整x轴坐标位置与大小
theme(axis.text.x=element_text(angle=45,colour="black",size=15,hjust=1));
注意hjust的值为0~1,用与调整横坐标与轴的距离
手动添加颜色
scale_fill_manual(values=c("grey","black"))
者scale_fill_manual(values=c(1,5))
调整y轴
	heme(axis.text.y=element_text(colour="black",size=改坐标标题

xlab("古菌属水平  Archaea genus level")+ylab("丰 度  Andance (%)")+theme(axis.title.x=element_text(size=15),axis.title.y=element_text(size=15))调整纵坐标的范围
ylim(0,60)
据order来排
aes(reordergenus,as.numeric(order)
##加error_ba
library(gckbook) # For the data set
 # Take a subset of the cabbage_exp data for this example
 ce <- subt(cabbage_exp, Cultivar == "c39")	 # With a bar graph	 ggplot(c aes(x=Date, y=Weight)
 geom_bar(fill="white", colour=black") +
 geom_errorbar(aes(ymin=Weighse, ymax=Weigt+se), width=.
参考资料:
http://stackoverflow.com/questions/25070547/ggplot-side-by-side
