【4.1】基因组浏览器绘制--wig
Wig,BigWig,BedGraph,这是几种在基因组浏览器上绘制图形的数据格式。
不同的数据格式可以满足不同的显示需求,下面我们一一来看:
介绍 wig 文件全称叫 Wiggle Track Format, 用来绘制基因组上的图形轨迹的文件格式。wig 格式是较老的格式,用来显示密集且连续的数据,比如GC含量,概率分数,转录组数据等。
wig 数据有两种类型:variableStep 和 fixedStep。
我们先来研究这两种类型的文件,后面在基因组浏览器中利用这些文件显示轨迹。
ucsc tracks: https://genome.ucsc.edu/cgi-bin/hgCustom?hgsid=1428454153_Gph8qEKtpTO38naFyWrKlxqLrCja
一、variableStep 格式
1.1、特点及适用场景:
- 在指定的染色体片段区域绘制条形图
- 用于全基因组数据集(大约百万分之十的数据点)
- 指定的区域必须为恒定大小(由span参数指定)
- 数据点间具有不规则间隔的数据,但是在某些情况下建议谨慎
- 如果数据点的不规则间距太极端,此格式在编码和显示期间可能效率很低。在这种情况下,“bedGraph”是最佳格式。
- 一般UCSC不建议采用该格式作为基因组浏览器输入文件,因为考虑到数据集大小与索引构建,都不如 bigwig 更高效
- 使用 wigToBigWig 将 Wig 转换为 bigWig 文件,文件格式转换详解
1.2、格式
声明行:以单词variableStep开头,后跟染色体规范。
数据行:两列,分别包含染色体位置和数据值。
variableStep  chrom=chrN
[span=windowSize]
  chromStartA  dataValueA
  chromStartB  dataValueB
  ... etc ...  ... etc ...
1.3、例子:
下面表示在2号染色体上的300701-300705位置均显示12.5
variableStep chrom=chr2
300701 12.5
300702 12.5
300703 12.5
300704 12.5
300705 12.5
可选的span参数(默认值:span = 1)允许更简洁地指定由连续的具有相同数据值的碱基组成的数据。
跨度从指定的每个染色体位置开始,并指示数据值应覆盖的碱基数。例如: 应用span=5后,相当于:
variableStep chrom=chr2 span=5
300701 12.5
wiggle 格式用于快速显示非常密集的数据。当每1,024个碱基只有几个数据点时,variableStep格式会变得效率极低。
如果variableStep数据点相距大于约100个碱基,则建议使用 BedGraph格式。
二、fixedStep 格式
1、特点及适用场景:
- 在指定的染色体片段区域绘制条形图
- 最适合用于全基因组数据集(大约百万分之十的数据点)
- 指定的区域必须为恒定大小(由span参数指定)
- 染色体位置精确地有规律的间隔(由step参数指定)
2、格式:
声明行:单词fixedStep开头,并包含染色体,起始坐标和步长的规范 。
数据行:一列,包含数据值。
fixedStep  chrom=chrN
start=position  step=stepInterval
[span=windowSize]
  dataValue1
  dataValue2
  ... etc ...
3、例子:
表示3号染色体上的三个区域(每个区域5个碱基):400601-400605、400701-400705和400801-400805,分别显示值11、22和33
fixedStep chrom=chr3 start=400601 step=100 span=5
11
22
33
对于variableStep和fixedStep格式,必须在整个数据集中使用相同的。如果未指定跨度,则使用默认跨度1。
顾名思义,fixedStep 在整个数据集中需要相同的大小步长。如果未指定,则步长为1。
三、数据值
wiggle 格式的数据值可以包含整数,实数,正值或负值,但不支持 NaN 值。未指定的位置没有数据,也就不会显示。
- 需要注意:wiggle文件(variableStep and fixedStep )的染色体坐标是从1开始。
- 例如,对于长度为N的染色体,第一个位置为1,最后一个位置为N。
- 对于 bigwig 文件,使用 wiggle 转换为 bigwig,使用的染色体坐标是从1开始。
- 而使用bedGraph格式创建的BigWig文件使用0开始。
自定义 wiggle 轨迹的参数
track type=wiggle_0 name=track_label
description=center_label
visibility=display_mode color=r,g,b
altColor=r,g,b priority=priority
autoScale=on|off alwaysZero=on|off
gridDefault=on|off
maxHeightPixels=max:default:min
graphType=bar|points
viewLimits=lower:upper
yLineMark=real-value yLineOnOff=on|off
windowingFunction=mean+whiskers|maximum|mean|minimum
smoothingWindow=off|2-16
其他参数
autoScale         <on|off>                             # default is on
alwaysZero        <on|off>                             # default is off
gridDefault       <on|off>                             # default is off
maxHeightPixels   <max:default:min>                    # default is 128:128:11
graphType         <bar|points>                         # default is bar
viewLimits        <lower:upper>                        # default is range found in data
viewLimitsMax     <lower:upper>                        # suggested bounds of viewLimits, but not enforced
yLineMark         <real-value>                         # default is 0.0
yLineOnOff        <on|off>                             # default is off
windowingFunction <mean+whiskers|maximum|mean|minimum> # default is maximum, mean+whiskers is recommended
smoothingWindow   <off|[2-16]>                         # default is off
transformFunc     <NONE|LOG>                           # default is NONE
例子
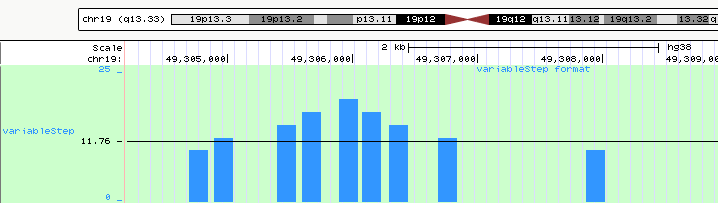
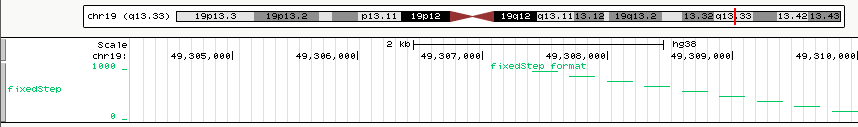
1、下面是 Wig 格式的文件,分别包含 variableStep 和 fixedStep 格式创建的两段轨迹
browser position chr19:49304200-49310700
browser hide all
#	150 base wide bar graph at arbitrarily spaced positions,
#	threshold line drawn at y=11.76
#	autoScale off viewing range set to [0:25]
#	priority = 10 positions this as the first graph
#	Note, one-relative coordinate system in use for this format
track type=wiggle_0 name="variableStep" description="variableStep format" visibility=full autoScale=off viewLimits=0.0:25.0 color=50,150,255 yLineMark=11.76 yLineOnOff=on priority=10
variableStep chrom=chr19 span=150
49304701 10.0
49304901 12.5
49305401 15.0
49305601 17.5
49305901 20.0
49306081 17.5
49306301 15.0
49306691 12.5
49307871 10.0
#	200 base wide points graph at every 300 bases, 50 pixel high graph
#	autoScale off and viewing range set to [0:1000]
#	priority = 20 positions this as the second graph
#	Note, one-relative coordinate system in use for this format
track type=wiggle_0 name="fixedStep" description="fixedStep format" visibility=full autoScale=off viewLimits=0:1000 color=0,200,100 maxHeightPixels=100:50:20 graphType=points priority=20
fixedStep chrom=chr19 start=49307401 step=300 span=200
1000
 900
 800
 700
 600
 500
 400
 300
 200
 100
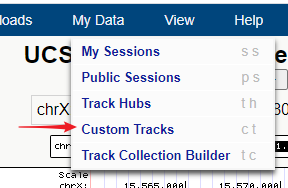
2、 选择菜单栏My Data的Custom Tracks
3、将上面的代码粘贴到输入框,点 Submit
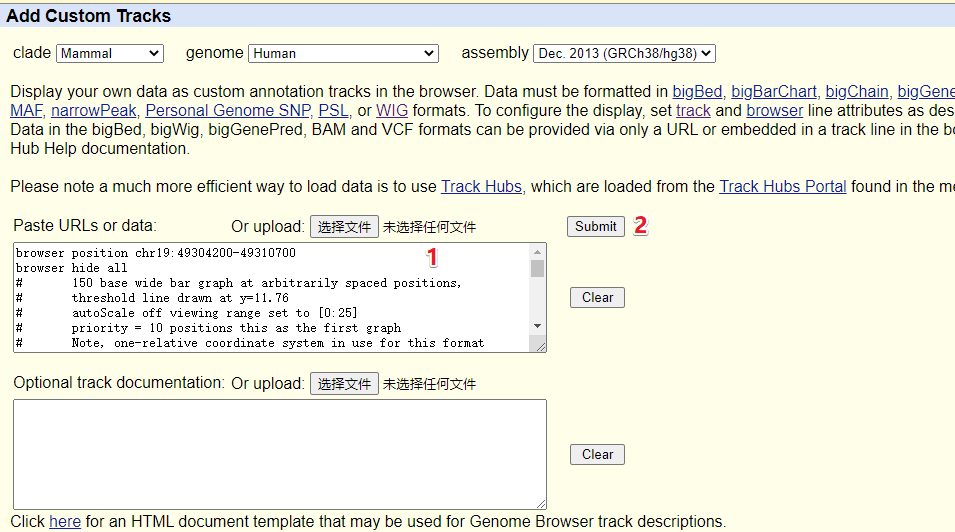
4、简要信息显示,点Go进行绘制
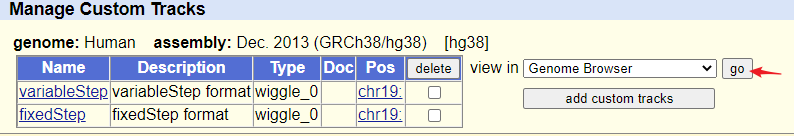
5、拿到绘制好的轨迹图
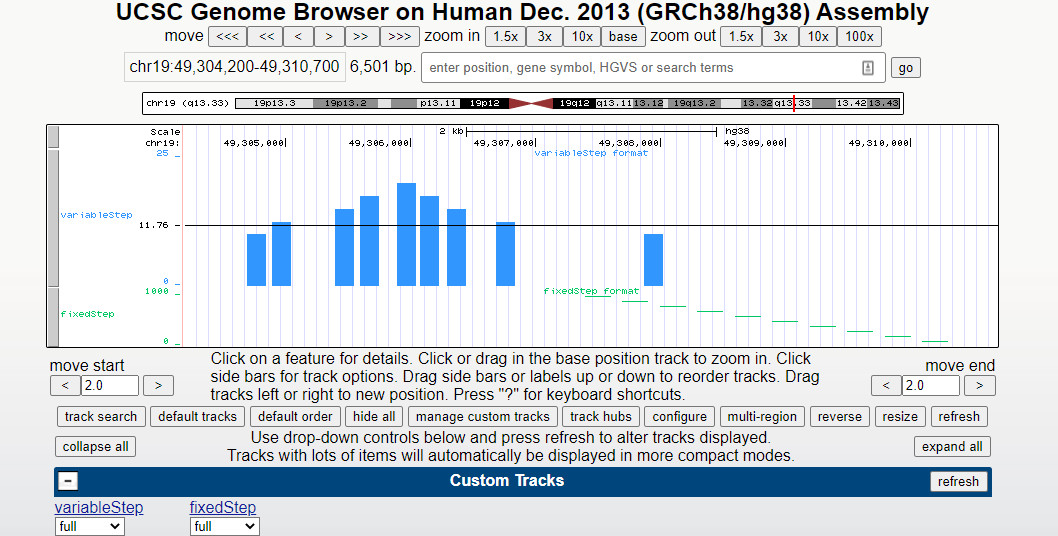
参考资料
