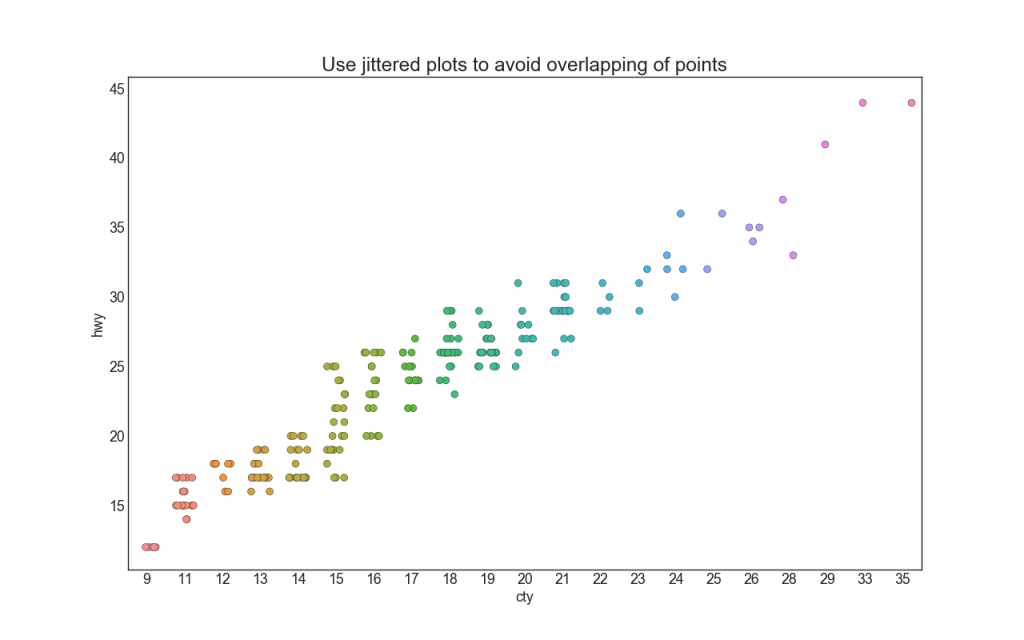
【2.1.4】抖动图(Jittering with stripplot)
通常,多个数据点具有完全相同的X和Y值。 结果,多个点相互绘制并隐藏。 为避免这种情况,请稍微抖动点,以便您可以直观地看到它们。 使用seaborn的stripplot()很方便。
# Import Data
df = pd.read_csv("https://raw.githubusercontent.com/selva86/datasets/master/mpg_ggplot2.csv")

# Draw Stripplot
fig, ax = plt.subplots(figsize=(16,10), dpi= 80)
sns.stripplot(df.cty, df.hwy, jitter=0.25, size=8, ax=ax, linewidth=.5)

# Decorations
plt.title('Use jittered plots to avoid overlapping of points', fontsize=22)
plt.show()
参考资料
药企,独角兽,苏州。团队长期招人,感兴趣的都可以发邮件聊聊:tiehan@sina.cn
![]() 个人公众号,比较懒,很少更新,可以在上面提问题,如果回复不及时,可发邮件给我: tiehan@sina.cn
个人公众号,比较懒,很少更新,可以在上面提问题,如果回复不及时,可发邮件给我: tiehan@sina.cn
