【2.4.8】分类图(Categorical Plots)
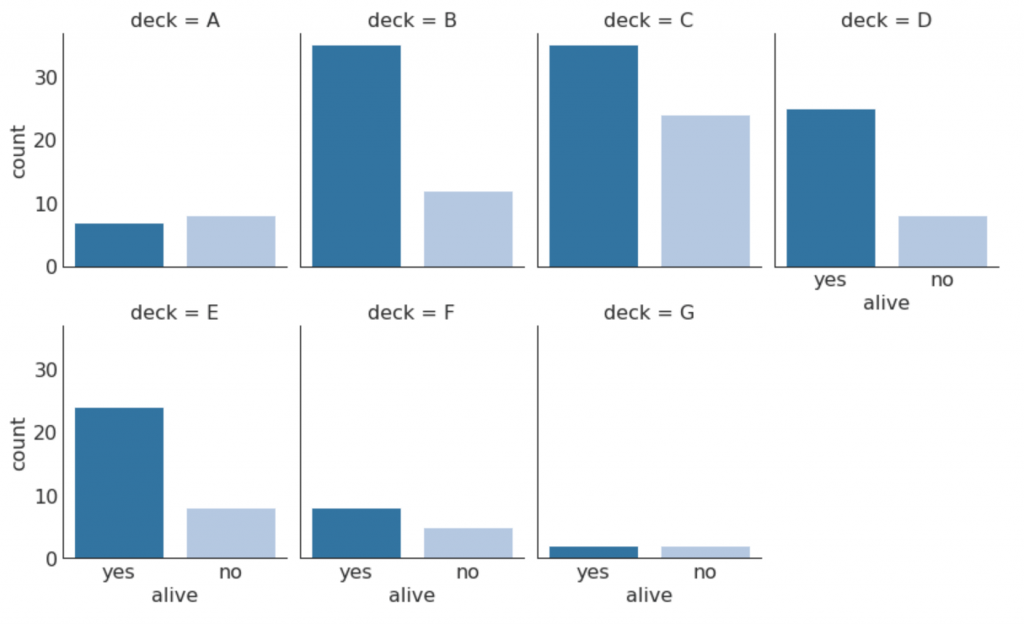
由seaborn库提供的分类图可用于可视化彼此相关的2个或更多分类变量的计数分布。
# Load Dataset
titanic = sns.load_dataset("titanic")

# Plot
g = sns.catplot("alive", col="deck", col_wrap=4,
                data=titanic[titanic.deck.notnull()],
                kind="count", height=3.5, aspect=.8,
                palette='tab20')

fig.suptitle('sf')
plt.show()
# Load Dataset
titanic = sns.load_dataset("titanic")
# Plot
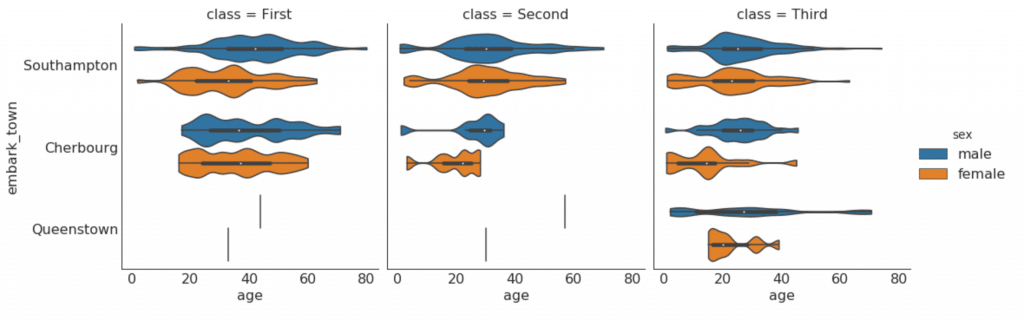
sns.catplot(x="age", y="embark_town",
hue="sex", col="class",
data=titanic[titanic.embark_town.notnull()],
orient="h", height=5, aspect=1, palette="tab10",
kind="violin", dodge=True, cut=0, bw=.2)
参考资料
药企,独角兽,苏州。团队长期招人,感兴趣的都可以发邮件聊聊:tiehan@sina.cn
![]() 个人公众号,比较懒,很少更新,可以在上面提问题,如果回复不及时,可发邮件给我: tiehan@sina.cn
个人公众号,比较懒,很少更新,可以在上面提问题,如果回复不及时,可发邮件给我: tiehan@sina.cn
