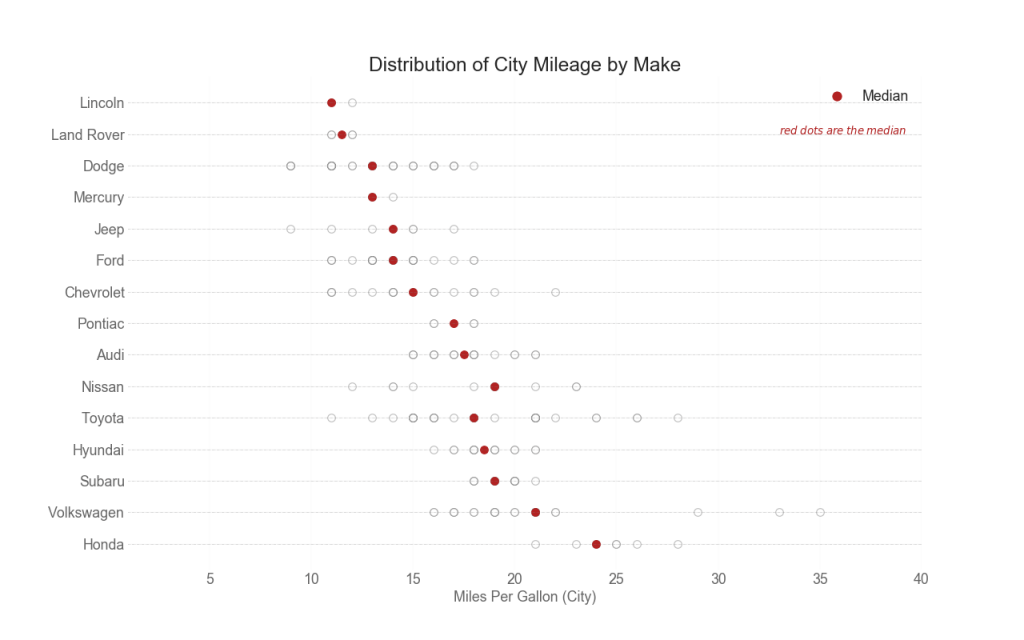
【2.4.4】分布式点图(Distributed Dot Plot)
import matplotlib.patches as mpatches

# Prepare Data
df_raw = pd.read_csv("https://github.com/selva86/datasets/raw/master/mpg_ggplot2.csv")
cyl_colors = {4:'tab:red', 5:'tab:green', 6:'tab:blue', 8:'tab:orange'}
df_raw['cyl_color'] = df_raw.cyl.map(cyl_colors)

# Mean and Median city mileage by make
df = df_raw[['cty', 'manufacturer']].groupby('manufacturer').apply(lambda x: x.mean())
df.sort_values('cty', ascending=False, inplace=True)
df.reset_index(inplace=True)
df_median = df_raw[['cty', 'manufacturer']].groupby('manufacturer').apply(lambda x: x.median())

# Draw horizontal lines
fig, ax = plt.subplots(figsize=(16,10), dpi= 80)
ax.hlines(y=df.index, xmin=0, xmax=40, color='gray', alpha=0.5, linewidth=.5, linestyles='dashdot')

# Draw the Dots
for i, make in enumerate(df.manufacturer):
    df_make = df_raw.loc[df_raw.manufacturer==make, :]
    ax.scatter(y=np.repeat(i, df_make.shape[0]), x='cty', data=df_make, s=75, edgecolors='gray', c='w', alpha=0.5)
    ax.scatter(y=i, x='cty', data=df_median.loc[df_median.index==make, :], s=75, c='firebrick')

# Annotate
ax.text(33, 13, "$red \; dots \; are \; the \: median$", fontdict={'size':12}, color='firebrick')

# Decorations
red_patch = plt.plot([],[], marker="o", ms=10, ls="", mec=None, color='firebrick', label="Median")
plt.legend(handles=red_patch)
ax.set_title('Distribution of City Mileage by Make', fontdict={'size':22})
ax.set_xlabel('Miles Per Gallon (City)', alpha=0.7)
ax.set_yticks(df.index)
ax.set_yticklabels(df.manufacturer.str.title(), fontdict={'horizontalalignment': 'right'}, alpha=0.7)
ax.set_xlim(1, 40)
plt.xticks(alpha=0.7)
plt.gca().spines["top"].set_visible(False)
plt.gca().spines["bottom"].set_visible(False)
plt.gca().spines["right"].set_visible(False)
plt.gca().spines["left"].set_visible(False)
plt.grid(axis='both', alpha=.4, linewidth=.1)
plt.show()
参考资料
药企,独角兽,苏州。团队长期招人,感兴趣的都可以发邮件聊聊:tiehan@sina.cn
![]() 个人公众号,比较懒,很少更新,可以在上面提问题,如果回复不及时,可发邮件给我: tiehan@sina.cn
个人公众号,比较懒,很少更新,可以在上面提问题,如果回复不及时,可发邮件给我: tiehan@sina.cn
