【2.2】seaborn小提琴图(seaborn-violinplot)
官网:https://seaborn.pydata.org/generated/seaborn.violinplot.html
批注
案例1
import seaborn as sns
sns.set(style="whitegrid")
tips = sns.load_dataset("tips")
ax = sns.violinplot(x=tips["total_bill"])

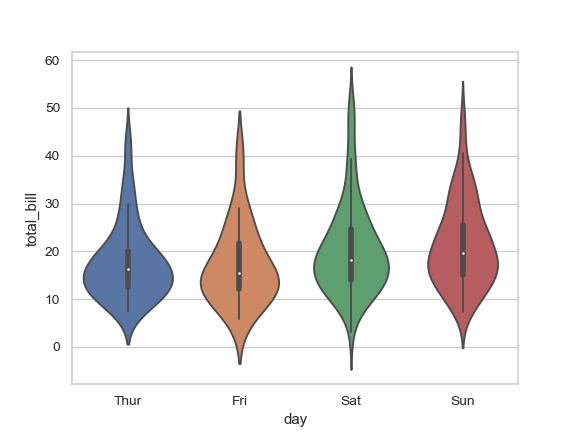
Draw a vertical violinplot grouped by a categorical variable:
ax = sns.violinplot(x="day", y="total_bill", data=tips)
Draw a violinplot with nested grouping by two categorical variables:
ax = sns.violinplot(x="day", y="total_bill", hue="smoker",
                data=tips, palette="muted")

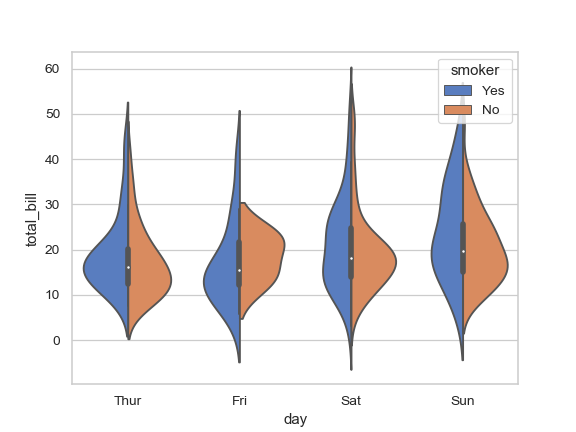
Draw split violins to compare the across the hue variable:
ax = sns.violinplot(x="day", y="total_bill", hue="smoker",
                data=tips, palette="muted", split=True)
药企,独角兽,苏州。团队长期招人,感兴趣的都可以发邮件聊聊:tiehan@sina.cn
![]() 个人公众号,比较懒,很少更新,可以在上面提问题,如果回复不及时,可发邮件给我: tiehan@sina.cn
个人公众号,比较懒,很少更新,可以在上面提问题,如果回复不及时,可发邮件给我: tiehan@sina.cn
