【4.1】秩和检验(Mann-Whitney U test; Wilcoxon rank-sum test)

在统计学中,Mann-Whitney U 检验(也称为 Mann-Whitney-Wilcoxon (MWW)、Wilcoxon rank-sum test或 Wilcoxon-Mann-Whitney 检验)是零假设的非参数检验,对于随机选择的值 来自两个种群的 X 和 Y,X 大于 Y 的概率等于 Y 大于 X 的概率。
一、配对资料的符号秩和检验
参数检验的定义:
在总体分布类型已知(如正态分布)的条件下,对其未 知参数检验。 如 t 检验和方差分析,都是基于总体分布为正态分布、总体方差相等的前提下对总体均数进行的检验。
非参数检验的定义:
若总体分布未知或已知总体分布与检验所要求的条件不 符,经数据转换也不能使其满足参数检验的条件,这时需要 采用一种不依赖于总体分布形式的检验方法。这种方法不是 对参数进行检验,而是检验总体分布位置是否相同,因而称 为非参数检验(nonparametric test)。
非参数检验的适用条件:
- 总体分布类型不明
- 总体分布呈偏态分布
- 数据一端或两端有不确定值的资料
- 总体方差不齐
- 有序分类变量资料
基于秩次的非参数检验
秩和检验(rank sum test),是一类常用的非参 数检验。 秩和检验是首先将数据按从小到大,或等级从弱到强转 换成秩后,再求秩和,计算检验统计量–秩和统计量,做 出统计推断。
配对资料的符号秩和检验(Wilcoxon signedrank test, Wilcoxon符号秩和检验)
例1. 对11份工业污水测定氟离子浓度(mg/L),每份水样同时 采用电极法及分光光度法测定,结果见表。问就总体而言, 这两种方法的测定结果有无差别?

Wilcoxon符号秩和检验
-
建立检验假设,确定检验水准
H0: 差值的总体中位数等于0 H1: 差值的总体中位数不等于0 α =0.05
-
计算检验统计量T值
-
求差值d
-
编秩:依差值的绝对值由小到大编秩 ; 差值为0,不编秩,且总的对子数相应减少;差值的绝对值相等,称为相持,取平均秩。
-
分别求正、负秩和 T+=43.5,T=11.5
-
确定统计量T :T=43.5或T=11.5
-
确定P值,做出推断
(1) 查表法(n≤50)
根据n(非零对子数)和T值,查T界值
由n=10,T=11.5或T=43.5,查表,得双侧P>0.10。按照 α =0.05 水准不拒绝H0,故据此资料尚不能认为两法测定结果有差别。
在配对样本中,由于随机误差的存在,各对差值的产生不可避免,假定两种处理的效应相同,则差值的总体分布为对称分布,并且差值的总体中位数为0。若此假设成立,样本差值的正秩和与负秩和应相差不大,均接近n(n+1)/4 ;当正负秩和相差悬殊, T++T=n(n+1)/2 超出抽样误差可解释的范围时,则有理由怀疑该假设,从而拒绝H0。
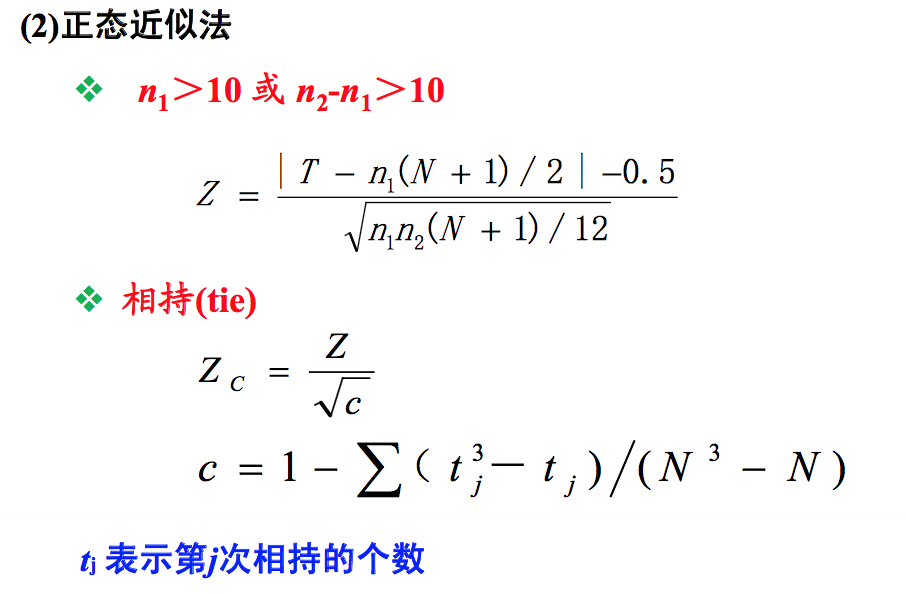
(2) 正态近似法(n>50):作正态近似检验

二、两组独立样本比较的秩和检验(Wilcoxon rank sum test)
推断连续型变量资料或有序变量资料的两个独立样本代 表的两个总体分布是否有差别。
2.1 两组连续型变量资料的秩和检验
例2 用两种药物杀灭钉螺,采集了14批活钉螺,随机分为两 组分别用甲、乙药物,用药后清点钉螺的死亡数,并计算每 批钉螺的死亡率(%),结果见表。问两种药物杀死钉螺的效 果有无差别?
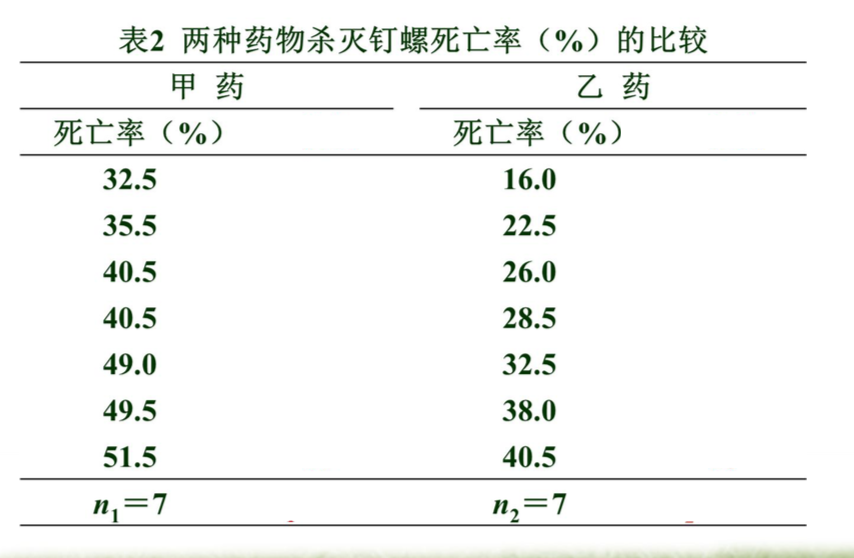
1.建立检验假设,确定检验水准
H0:两种药物杀灭钉螺死亡率的总体中位数相等
H1:两种药物杀灭钉螺死亡率的总体中位数不相等
α =0.05
2.计算检验统计量T值
- 编秩:将两组数据混合,由小到大统一编秩;不同组遇到相同数 据取平均秩次。
- 求各组秩和:以样本例数较小者为n1,其秩和为T1。
- 确定检验统计量T值 : 若n1≠n2,则T=T1;若n1=n2,则T=T1或T=T2。
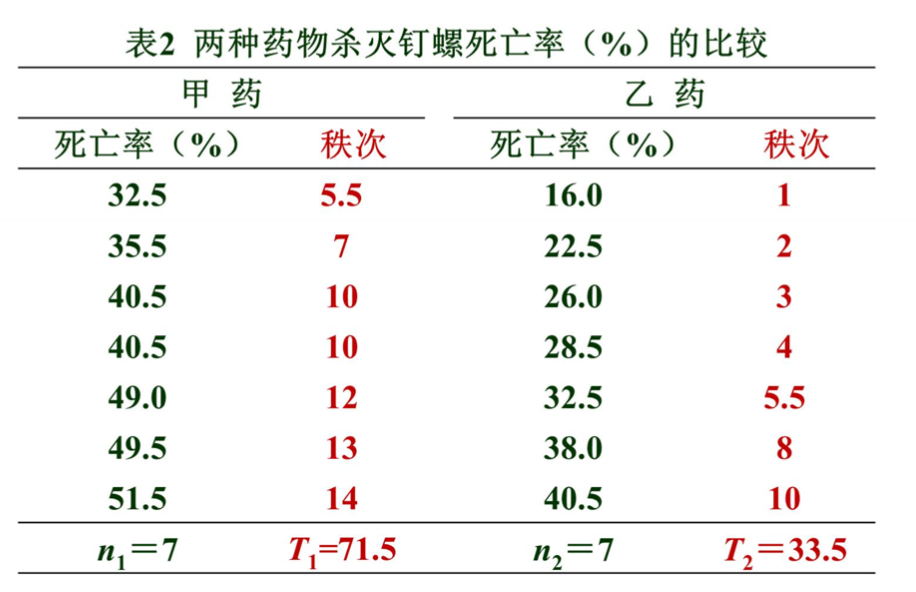
假设含量为n1与n2的两个样本(且n1≤n2),来自同一总 体或分布相同的两个总体,则n1样本的秩和T1与其理论秩和 (N(N+1)/2)/2不大,即[T1 -n1(N+1)/2]仅为抽样误差所致。当 二者相差悬殊,超出抽样误差可解释的范围时,则有理由怀 疑该假设,从而拒绝H0。
3.确定P值,做出推断
(1) 查表法
当n1 ≤ 10,且n2-n1 ≤ 10时,查T界值表。
双侧0.01<P<0.02 内大外小
按照 α =0.05 水准,拒绝H0,可以认为两种药物杀灭钉螺的效果有差别。
2.2 两组有序分类变量资料的秩和检验
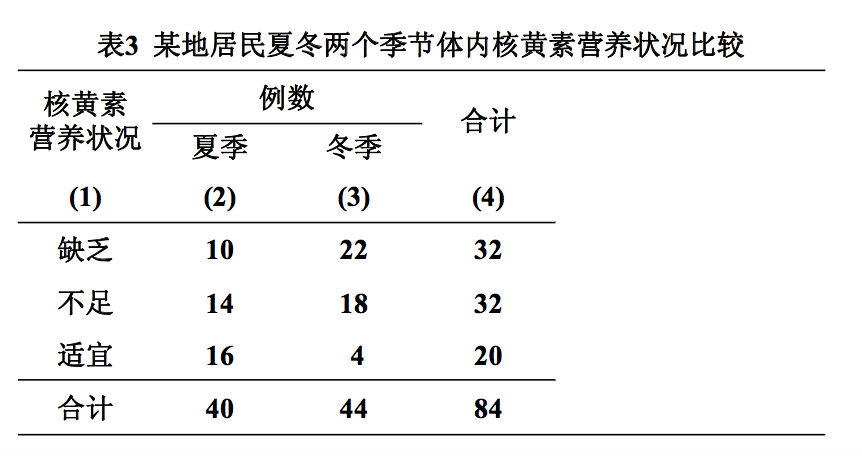
例3 某医科大学营养教研室为了解居民体内核黄素营养状况, 于某年夏冬两个季节收集成年居民口服5mg核黄素后4小时的 负荷尿,测定体内核黄素含量,结果见表,试比较该地居民 夏冬两个季节体内核黄素含量有无差别?
1.建立检验假设,确定检验水准
H0:夏冬两个季节居民体内核黄素含量的总体分布位置相同
H1:夏冬两个季节居民体内核黄素含量的总体分布位置不同
α =0.05
2.计算检验统计量T值
(1) 编秩:将两组数据合并,按等级由小到大统一编秩。
先计算各等级合计数,并确定各等级秩次范围,求出各等级的平均秩次。
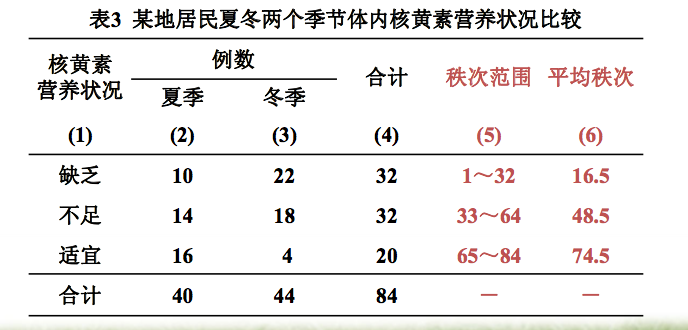
(1)求各组秩和:各等级的平均秩次分别乘以各组在各等级的例数,再求和,即得到各组秩和。
n1=40, n2=44, N=n1+n2=84 T1=16.5×10+48.5×14+74.5×16=2036 T2=16.5×22+48.5×18+74.5×4=1534
(3) 确定统计量T值 : T=T1=2036。
3.确定P值,做出推断

P<0.001。按照a = 0.05水准,拒绝H0,接受H1,故可认为夏冬两个 季节居民体内核黄素含量有差别。
三、多组独立样本比较的秩和检验
3.1多组独立样本比较的秩和检验(KruskalWallis H检验)
推断定量变量或有序分类变量的多个总体分布有无差别
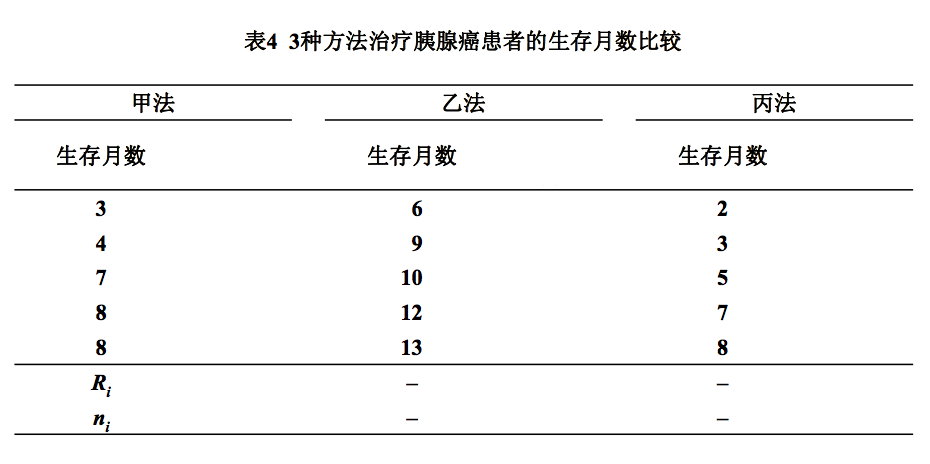
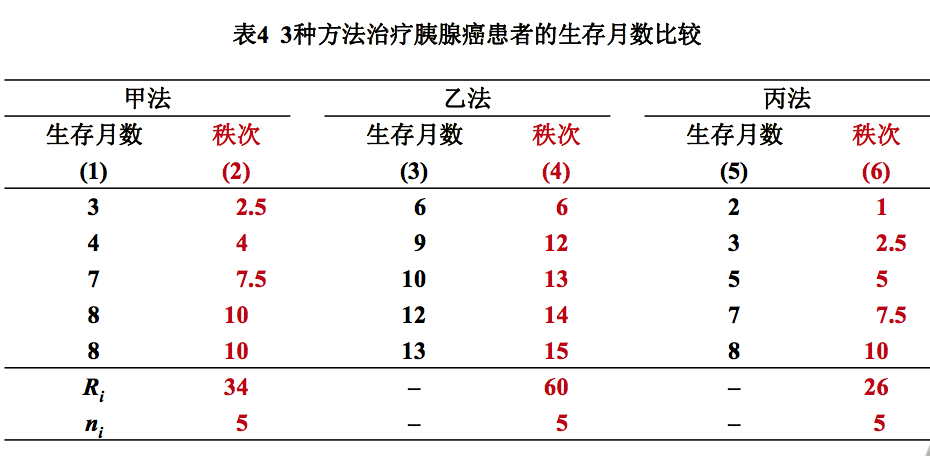
例4 某医院用3种不同方法治疗15例胰腺癌患者,每种方法 各治疗5例。治疗后生存月数见表,问这3种方法对胰腺癌患 者的疗效有无差别?
1.建立检验假设,确定检验水准
H0:3种方法治疗后患者生存月数的总体中位数相等
H1:3种方法治疗后患者生存月数的总体中位数不全相等
α =0.05
2.计算检验统计量H值
1).编秩 将三组数据合并,其余步骤同两组定量变量资料 2).求各组秩和Ri
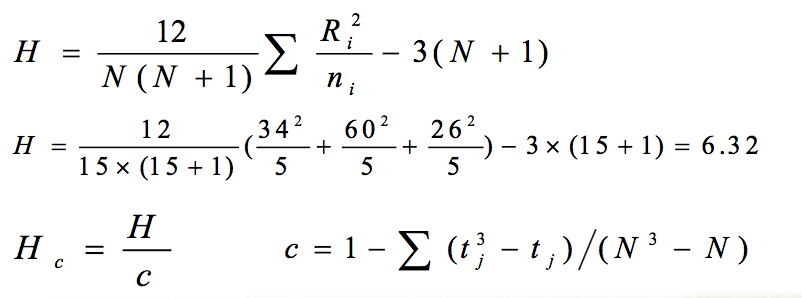
3). 确定检验统计量H值 :
3、确定P值,做出推断
(1) 查H界值表
- 当组数k=3,且各组例数ni≤5时,可查H界值表得到P值。
- P<0.05。按照a=0.05水准,拒绝H0,接受H1,故可认为3种方法治疗后胰腺癌患者的生存月数有差别。
(2) 查χ2界值表
当组数或各组例数超出H界值表时,由于H0成立时H值近似地服 从n =k1的χ2分布,此时可由χ2界值表得到P值。
3.2 有序变量多组独立样本的秩和检验
某医院用3种方法治疗慢性喉炎,结果见表,问这3种方法的疗效是否有差别?

1.建立检验假设,确定检验水准
H0:3种治疗方法治疗效果的总体分布位置相同
H1:3种治疗方法治疗效果的总体分布位置不全相同
α =0.05
2.计算检验统计量H值
(1) 编秩 同两组有序分类变量资料

(2) 求各组秩和:各组各等级的频数与平均秩次的乘积之和。
R1 =32.5×24+96.5×26+183.5×72+358.5×186 = 83182
R2 =32.5×20+96.5×16+183.5×24+358.5×32 = 18070
R3 =32.5×20+96.5×22+183.5×14+358.5×22 = 13229
(3)计算检验统计量H值

c = 1-[(643-64)+(6433-64)+(11033-110)+(2403-240)]/(4783-478)=0.856 Hc=44.011/0.856=51.41
3.确定P值,做出推断
k=3,各组例数均大于5,可由 v =3-1=2 查χ2界值表,得P<0.005。 按照 α = 0.05水准,拒绝H0,接受H1,故可认为3种方法治疗慢性喉 炎的效果有差别。
四、多个独立样本间的多重比较

例6 对例5资料做三个样本间的两两比较。
1、建立检验假设,确定检验水准
H0: 第i种与第j种方法疗效的总体分布位置相同
H1: 第i种与第j种方法疗效的总体分布位置不同
α =0.05
2、计算检验统计量 t 值
(1)求各组平均秩次 Ri
甲组: R1 = 83182/308 = 270.07 乙组: R2 =18070/92 =196.41 丙组: R3 =13229/78 =169.60
(2)列出两两比较计算表,求得 t 值

3、确定P值,做出推断
以 v = 478-3=475 查 t 界值表,得P值。按照α =0.05水准,甲组与 乙组、甲组与丙组比较,均拒绝H0;而乙组与丙组比较不拒绝H0, 故可认为3种方法治疗慢性喉炎疗效的差别主要存在于甲法与其他两法之间,而乙法与丙法间的疗效尚不能认为有差别。
五、总结
- 非参数检验是不依赖总体分布类型,也不对总体参数进行 推断的一类统计方法。
- 非参数检验不受总体分布的限制,适用范围广,但对服从 参数检验条件的资料采用非参数检验进行分析时,会降低 检验效能,增加犯II类错误的概率。
非参数检验适用于:
- 总体分布类型不明
- 总体分布呈偏态分布
- 数据一端或两端有不确定值的资料
- 总体方差不齐
- 有序分类变量资料
- 秩和检验是将原数据转换为秩次,比较各组秩和的非参数检验。
- 有序分类变量资料选用非参数检验,可推断各等级强度的 差别,而用R×C列联表χ2检验,只能比较频数分布之间的差别。
| 设计类型 | 非参数检验 | 参数检验 |
|---|---|---|
| 单样本资料 | Wilcoxon符号秩和检验 | 单样本t检验 |
| 配对设计资料 | Wilcoxon符号秩和检验 | 配对t检验 |
| 两组独立样本资料 | Wilcoxon秩和检验 | 两样本t检验 |
| 多组独立样本资料 | KruskalWallisH检验 扩展的t检验 | 单因素方差分析 q检验 |
六、讨论
6.1 算法:
In this example, we have a set of 20 reads, 10 of which support the reference allele and 10 of which support the alternate allele. At first glance, that looks like a clear heterozygous 0/1 site. But to be thorough in our analysis and to account for any technical bias, we want to determine if there is a significant difference in the base qualities of the bases that support the reference allele vs. the bases that support the alternate allele.
Before we proceed, we must define our null hypothesis and alternate hypothesis.
-Null hypothesis: There is no difference in the base qualities that support the reference allele and the base qualities that support the alternate allele.
-Alternate hypothesis: There is a difference in the base qualities that support the reference allele and the base qualities that support the alternate allele.
Step 1: List the relevant observations
Reference allele base qualities: 20, 25, 26, 30, 32, 40, 47, 50, 53, 60 Alternate allele base qualities: 0, 7, 10, 17, 20, 21, 30, 34, 40, 45
Step 2: Rank the observations
First, we arrange all the observations (base qualities) into a list of values ordered from lowest to highest (reference bases are in bold).
0, 7, 10, 17, **20**, 20, 21, **25**, **26**, **30**, 30, **32**, 34, **40**, 40, 45, **47**, **50**, **53**, **60**
Next we determine the ranks of the values. Since there are 20 observations (the base qualities), we have 20 ranks to assign. Whenever there are ties between observations for the rank, we take the rank to be equal to the midpoint of the ranks. For example, for 20(ref) and 20(alt), we have a tie in values, so we assign each observation a rank of (5+6)/2 = 5.5.
The ranks from the above list are (reference ranks are in bold):
1, 2, 3, 4, **5.5**, 5.5, 7, **8**, **9**, **10.5**, 10.5, **12**, 13, **14.5**, 14.5, 16, **17**, **18**, **19**, **20**
Step 3: Add up the ranks for each group
We now need to add up the ranks for the base qualities that came from the reference allele and the alternate allele.
Rankref=133.5Rankref=133.5
Rankalt=76.5Rankalt=76.5
Step 4: Calculate U for each group
U is a statistic that tells us the difference between the two rank totals. We can use the U statistic to calculate the z-score (explained below), which will give us our p-value.
Calculate U for each group (n = number of observations in each sample)
$$ U_{ref} = \frac{ n_{ref} _n{alt} + n{ref} _(n_{ref}+ 1) }{ 2 } - Rank_{ref} $$

$$ U_{alt} = \frac{ n_{alt} _n{ref} + n{alt} _(n_{alt} + 1) }{ 2 } - Rank_{alt} $$

$$ U_{ref} = \frac{ 10 _10 + 10 _11 }{ 2 } - 133.5 = 21.5 $$

$$ U_{alt} = \frac{ 10 _10 + 10 _11 }{ 2 } - 76.5 = 78.5 $$
Step 5: Calculate the overall z-score
Next, we need to calculate the z-score which will allow us to get the p-value. The z-score is a normalized score that allows us to compare the probability of the U score occurring in our distribution. https://statistics.laerd.com/statistical-guides/standard-score.php
The equation to get the z-score is:
z=U−muuz=U−muu
Breaking this equation down:
z=z−scorez=z−score
U=lowest of the U scores calculated in previous stepsU=lowest of the U scores calculated in previous steps
$$ mu = \text{mean of the U scores above} = \frac{ n_{ref} * n_{alt} }{ 2 } $$

$$ u = \text{standard deviation of U} = \sqrt{ \frac{n_{ref} * n_{alt} * (n_{ref} + n_{alt} + 1) }{ 12 } } $$
To calculate our z:
U=21.5U=21.5


mu=10∗102=50mu=10∗102=50

$$ u = \sqrt{ \frac{10 _10 _(10 + 10 + 1) }{ 12 } } = 13.229 $$
So altogether we have:
z=21.5−5013.229=−2.154z=21.5−5013.229=−2.154
Step 6: Calculate and interpret the p-value
The p-value is the probability of obtaining a z-score at least as extreme as the one we got, assuming the null hypothesis is true. In our example, the p-value gives us the probability that there is no difference in the base qualities that support the reference allele and the base qualities that support the alternate allele. The lower the p-value, the less likely it is that there is no difference in the base qualities.
Going to the z-score table, or just using a p-value calculator, we find the p-value to be 0.0312.
This means there is a .0312 chance that the base quality scores of the reference allele and alternate allele are the same. Assuming a p-value cutoff of 0.05, meaning there is less than 5% chance there is no difference in the two groups, and greater than or equal to 95% chance that there is a difference between the two groups, we have enough evidence to reject our null hypothesis that there is no difference in the base qualities of the reference and alternate allele. This indicates there is some bias and that the alternate allele is less well supported by the data than the allele counts suggest.
6.2 代码实现
6.2.1 R的具体实现
a = c(6, 8, 2, 4, 4, 5)
b = c(7, 10, 4, 3, 5, 6)

wilcox.test(a,b, correct=FALSE)

Wilcoxon rank sum test

data: a and b
W = 14, p-value = 0.5174
alternative hypothesis: true location shift is not equal to 0
p-value大于0.05,因此我们可接受null hypothesis H0,即两个群组的均值统计相等。
6.2.2 python的具体实现
x=[57.07168,46.95301,31.86423,38.27486,77.89309,76.78879,33.29809,58.61569,18.26473,62.92256,50.46951,19.14473,22.58552,24.14309]

y=[8.319966,2.569211,1.306941,8.450002,1.624244,1.887139,1.376355,2.521150,5.940253,1.458392,3.257468,1.574528,2.338976]

scipy.stats.ranksums(x, y)

(4.415880433163923, 1.0059968254463979e-05)
参考资料
