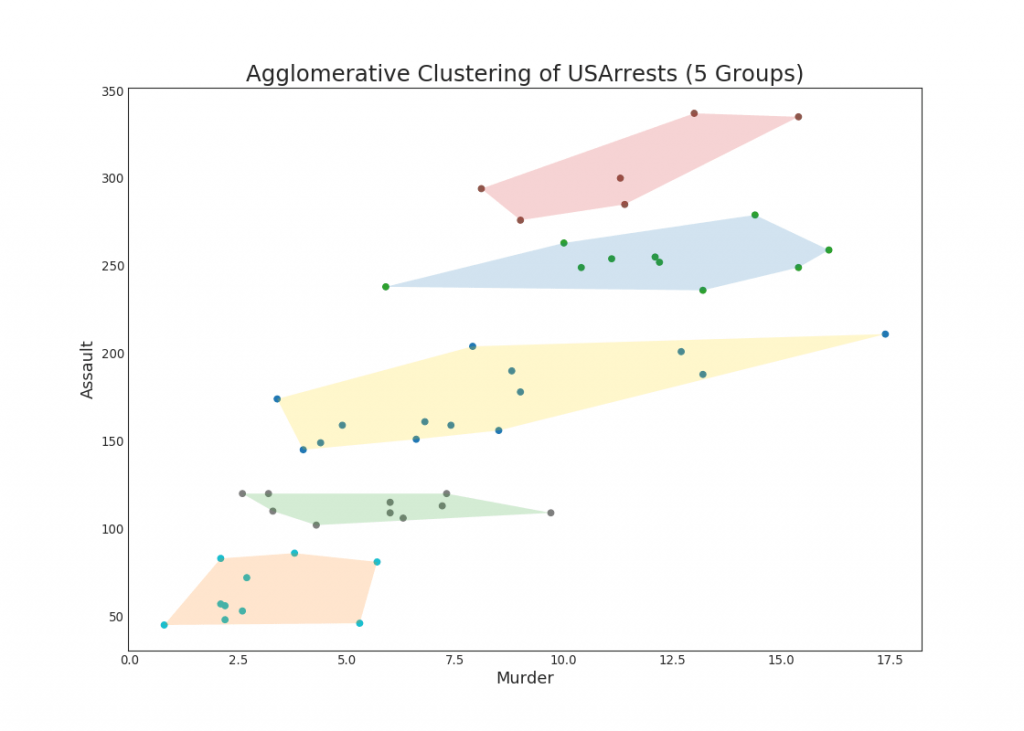
【2.7.2】簇状图(Cluster Plot)
Cluster Plot可用于划分属于同一群集的点。 下面是根据USArrests数据集将美国各州分为5组的代表性示例。 该集群图使用“谋杀”和“攻击”列作为X和Y轴。 或者,您可以将第一个到主要组件用作X轴和Y轴。

from sklearn.cluster import AgglomerativeClustering
from scipy.spatial import ConvexHull

# Import Data
df = pd.read_csv('https://raw.githubusercontent.com/selva86/datasets/master/USArrests.csv')

# Agglomerative Clustering
cluster = AgglomerativeClustering(n_clusters=5, affinity='euclidean', linkage='ward')
cluster.fit_predict(df[['Murder', 'Assault', 'UrbanPop', 'Rape']])

# Plot
plt.figure(figsize=(14, 10), dpi= 80)
plt.scatter(df.iloc[:,0], df.iloc[:,1], c=cluster.labels_, cmap='tab10')

# Encircle
def encircle(x,y, ax=None, **kw):
    if not ax: ax=plt.gca()
    p = np.c_[x,y]
    hull = ConvexHull(p)
    poly = plt.Polygon(p[hull.vertices,:], **kw)
    ax.add_patch(poly)

# Draw polygon surrounding vertices
encircle(df.loc[cluster.labels_ == 0, 'Murder'], df.loc[cluster.labels_ == 0, 'Assault'], ec="k", fc="gold", alpha=0.2, linewidth=0)
encircle(df.loc[cluster.labels_ == 1, 'Murder'], df.loc[cluster.labels_ == 1, 'Assault'], ec="k", fc="tab:blue", alpha=0.2, linewidth=0)
encircle(df.loc[cluster.labels_ == 2, 'Murder'], df.loc[cluster.labels_ == 2, 'Assault'], ec="k", fc="tab:red", alpha=0.2, linewidth=0)
encircle(df.loc[cluster.labels_ == 3, 'Murder'], df.loc[cluster.labels_ == 3, 'Assault'], ec="k", fc="tab:green", alpha=0.2, linewidth=0)
encircle(df.loc[cluster.labels_ == 4, 'Murder'], df.loc[cluster.labels_ == 4, 'Assault'], ec="k", fc="tab:orange", alpha=0.2, linewidth=0)

# Decorations
plt.xlabel('Murder'); plt.xticks(fontsize=12)
plt.ylabel('Assault'); plt.yticks(fontsize=12)
plt.title('Agglomerative Clustering of USArrests (5 Groups)', fontsize=22)
plt.show()
参考资料
这里是一个广告位,,感兴趣的都可以发邮件聊聊:tiehan@sina.cn
![]() 个人公众号,比较懒,很少更新,可以在上面提问题,如果回复不及时,可发邮件给我: tiehan@sina.cn
个人公众号,比较懒,很少更新,可以在上面提问题,如果回复不及时,可发邮件给我: tiehan@sina.cn

