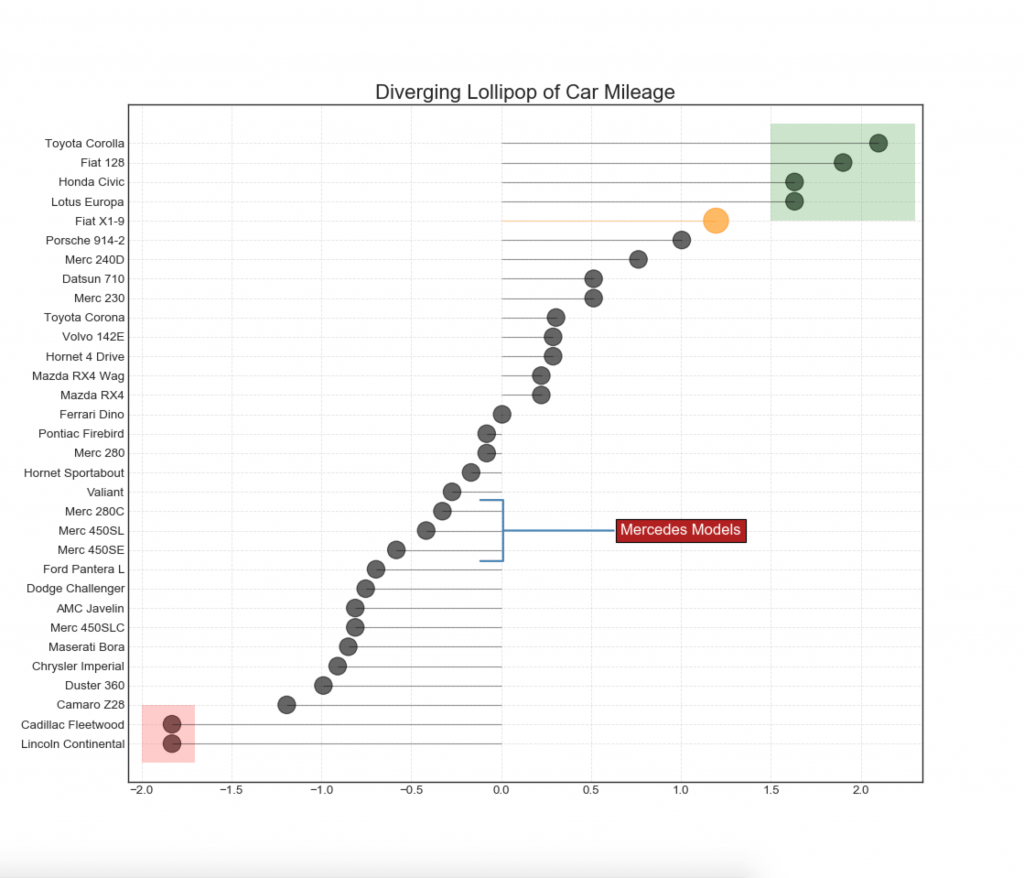
【2.2.4】带标记的发散型棒棒糖图(Diverging Lollipop Chart with Markers)
带标记的棒棒糖通过强调您想要引起注意的任何重要数据点,并在图表中适当地给出推理,提供了一种可视化分歧的灵活方式。

# Prepare Data
df = pd.read_csv("https://github.com/selva86/datasets/raw/master/mtcars.csv")
x = df.loc[:, ['mpg']]
df['mpg_z'] = (x - x.mean())/x.std()
df['colors'] = 'black'

# color fiat differently
df.loc[df.cars == 'Fiat X1-9', 'colors'] = 'darkorange'
df.sort_values('mpg_z', inplace=True)
df.reset_index(inplace=True)


# Draw plot
import matplotlib.patches as patches

plt.figure(figsize=(14,16), dpi= 80)
plt.hlines(y=df.index, xmin=0, xmax=df.mpg_z, color=df.colors, alpha=0.4, linewidth=1)
plt.scatter(df.mpg_z, df.index, color=df.colors, s=[600 if x == 'Fiat X1-9' else 300 for x in df.cars], alpha=0.6)
plt.yticks(df.index, df.cars)
plt.xticks(fontsize=12)

# Annotate
plt.annotate('Mercedes Models', xy=(0.0, 11.0), xytext=(1.0, 11), xycoords='data',
            fontsize=15, ha='center', va='center',
            bbox=dict(boxstyle='square', fc='firebrick'),
            arrowprops=dict(arrowstyle='-[, widthB=2.0, lengthB=1.5', lw=2.0, color='steelblue'), color='white')

# Add Patches
p1 = patches.Rectangle((-2.0, -1), width=.3, height=3, alpha=.2, facecolor='red')
p2 = patches.Rectangle((1.5, 27), width=.8, height=5, alpha=.2, facecolor='green')
plt.gca().add_patch(p1)
plt.gca().add_patch(p2)

# Decorate
plt.title('Diverging Bars of Car Mileage', fontdict={'size':20})
plt.grid(linestyle='--', alpha=0.5)
plt.show()
参考资料
这里是一个广告位,,感兴趣的都可以发邮件聊聊:tiehan@sina.cn
![]() 个人公众号,比较懒,很少更新,可以在上面提问题,如果回复不及时,可发邮件给我: tiehan@sina.cn
个人公众号,比较懒,很少更新,可以在上面提问题,如果回复不及时,可发邮件给我: tiehan@sina.cn

