【3.5.2】matplotlib-label
一、添加label
1.1 plt
matplotlib.pyplot.xlabel(xlabel, fontdict=None, labelpad=None, **kwargs)
1.2 ax
例1:
plt.rcParams['savefig.facecolor'] = "0.8"
def example_plot(ax, fontsize=12):
    ax.plot([1, 2])
    ax.locator_params(nbins=3)
    ax.set_xlabel('x-label', fontsize=fontsize)
    ax.set_ylabel('y-label', fontsize=fontsize)
    ax.set_title('Title', fontsize=fontsize)
plt.close('all')
fig, ax = plt.subplots()
example_plot(ax, fontsize=24)
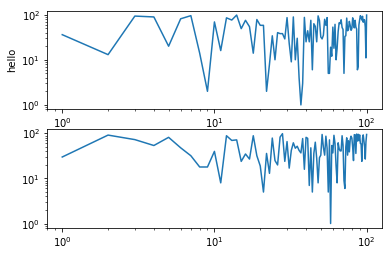
例2:添加axis标签
import matplotlib.pyplot as plt
import random

x = range(1, 101)
y1 = [random.randint(1, 100) for _ in xrange(len(x))]
y2 = [random.randint(1, 100) for _ in xrange(len(x))]

fig2 = plt.figure()
ax3 = fig2.add_subplot(2,1,1)
ax4 = fig2.add_subplot(2,1,2)
ax3.loglog(x, y2)
ax4.loglog(x, y1)

ax3.set_ylabel('hello')
plt.show()

二、讨论
2.1 合并子图axis标签
import random
import matplotlib.pyplot as plt

x = range(1, 101)
y1 = [random.randint(1, 100) for _ in xrange(len(x))]
y2 = [random.randint(1, 100) for _ in xrange(len(x))]

fig = plt.figure()
ax = fig.add_subplot(111)    # The big subplot
ax1 = fig.add_subplot(211)
ax2 = fig.add_subplot(212)

# Turn off axis lines and ticks of the big subplot
ax.spines['top'].set_color('none')
ax.spines['bottom'].set_color('none')
ax.spines['left'].set_color('none')
ax.spines['right'].set_color('none')
ax.tick_params(labelcolor='w', top='off', bottom='off', left='off', right='off')

ax1.loglog(x, y1)
ax2.loglog(x, y2)

# Set common labels
ax.set_xlabel('common xlabel')
ax.set_ylabel('common ylabel')

ax1.set_title('ax1 title')
ax2.set_title('ax2 title')

# plt.savefig('common_labels.png', dpi=300)
plt.show()

2.2 调整x轴label的位置
ax.xaxis.set_label_coords(-0.2, -0.1)
2.3 特殊字体
matplotlib支持latex,可以以这种形式加入一些比较特殊的符号
plt.xlabel('%s CA Distance ' % ssbond_loc + r'$(\AA)$', size=24)
参考资料
这里是一个广告位,,感兴趣的都可以发邮件聊聊:tiehan@sina.cn
![]() 个人公众号,比较懒,很少更新,可以在上面提问题,如果回复不及时,可发邮件给我: tiehan@sina.cn
个人公众号,比较懒,很少更新,可以在上面提问题,如果回复不及时,可发邮件给我: tiehan@sina.cn

