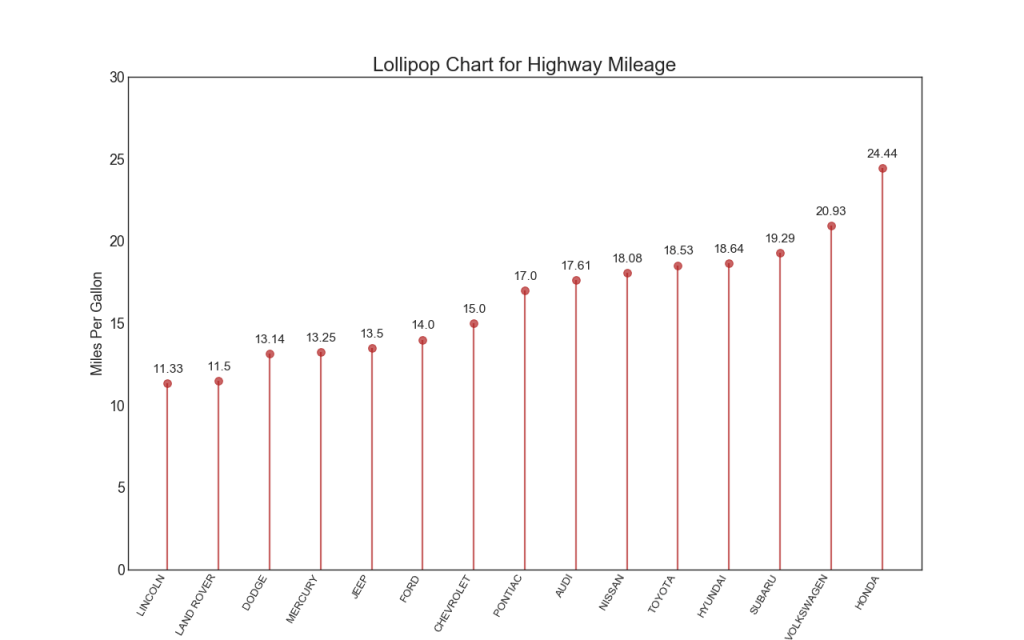
【2.3.2】棒棒糖图(Lollipop Chart)
棒棒糖图表以一种视觉上令人愉悦的方式提供与有序条形图类似的目的。

# Prepare Data
df_raw = pd.read_csv("https://github.com/selva86/datasets/raw/master/mpg_ggplot2.csv")
df = df_raw[['cty', 'manufacturer']].groupby('manufacturer').apply(lambda x: x.mean())
df.sort_values('cty', inplace=True)
df.reset_index(inplace=True)

# Draw plot
fig, ax = plt.subplots(figsize=(16,10), dpi= 80)
ax.vlines(x=df.index, ymin=0, ymax=df.cty, color='firebrick', alpha=0.7, linewidth=2)
ax.scatter(x=df.index, y=df.cty, s=75, color='firebrick', alpha=0.7)

# Title, Label, Ticks and Ylim
ax.set_title('Lollipop Chart for Highway Mileage', fontdict={'size':22})
ax.set_ylabel('Miles Per Gallon')
ax.set_xticks(df.index)
ax.set_xticklabels(df.manufacturer.str.upper(), rotation=60, fontdict={'horizontalalignment': 'right', 'size':12})
ax.set_ylim(0, 30)

# Annotate
for row in df.itertuples():
    ax.text(row.Index, row.cty+.5, s=round(row.cty, 2), horizontalalignment= 'center', verticalalignment='bottom', fontsize=14)

plt.show()
参考资料
这里是一个广告位,,感兴趣的都可以发邮件聊聊:tiehan@sina.cn
![]() 个人公众号,比较懒,很少更新,可以在上面提问题,如果回复不及时,可发邮件给我: tiehan@sina.cn
个人公众号,比较懒,很少更新,可以在上面提问题,如果回复不及时,可发邮件给我: tiehan@sina.cn

