【2.3】ggplot—散点图(geom_point)
这里整理一下常见的散点
一、例一
seqs      WS_bac            DSZ_bac           DSZ_arc            WS_arc
10         1            1            1            4.35505
20         9.60793            9.61334            5.25596            5.84429
30         16.5786            16.6393            6.84235            6.75812
40         22.6062            22.7745            7.92324            7.45446
50         28.0227            28.3326            8.79244            8.05028
60         33.0079            33.4752            9.5462               8.58972
70         37.6698            38.2964            10.2294            9.0914
……
根据上面的数据,以seqs为横坐标,其他四列为纵坐标做出散点图。
1,数据读取(上面的数据中有的为NA,)
ni<-read.csv("稀释性曲线.txt",header=T,sep="\t")
2,数据变形
library(reshape2)
agcd<-melt(ni,id.vars="seqs",value.name="value",variable.name="bq");
3,作图
library(ggplot2)
ggplot(agcd,aes(seqs,value))+geom_point()
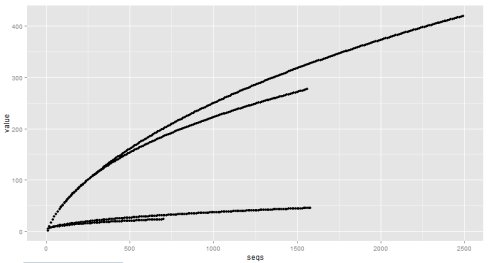
这个初步的图做出来后有四点不满意
- 点太多区分度不够好;
- 每条线没有图注;
- 背景不好看;
- 横纵坐标;
解决办法:
1,点太多区分度不够好
提取数据的奇数行,减少数据集
nii<-ni[seq(1,nrow(ni),2),]
重新数据变形
library(reshape2);
librarggplot2);
agcd<-melt(nii,id.vars="seqs",value.name="value",variable.name="bq");
2,加上图注
p<-ggplot(agcd,aes(seqs,value))+geom_point()
p1<-p+s(shape=bq)+scale_shape_manual(values=c(1,2,6,23))
p1
3,去掉背景
p2<-p1+theme(panel.background=element_blank(),panel.grid.minor=element_blank(),
axis.li=element_line(size=0.5),legend.title=element_blank());
p2
4,Legend放大
library(grid);
p3<-p2+theme(legend.title=element_blank())+theme(legend.key.size=unit(2,'cm'),
legend.text = element_text(size = 10, hst = 3, vjust = 3, face = 'bold'));
p3
5,横纵坐标轴变大,同时加上合适字体的横纵坐标的主题
p4<-p3+theme(axis.text.x=element_text(size=15,colour="black"),axis.text.y=element_text(size=15,
colour="black"))+xlab("序列数  Sequences quantity")+ylab("OTU个数  OTU quantity")+theme(axis.title.x=element_text(size=15),axis.title.y=element_text(size=15));
p4
整个的流程为:
1,生成数据部分
ni<-read.csv("稀释性曲线.txt",header=T,sep="\t");
nii<-ni[seq(1,nrow(ni),2),];
library(reshape2);
agcd<-melt(nii,id.vars="seqs",value.name="value",variable.name="bq");
library(ggplot2);
2,作图部分
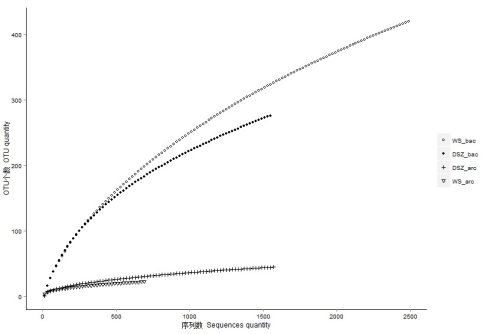
有两个命令可供参考,一个就是按照上面的流程修改了参数的大小值,另一个是没有修改大小的。选用如下的哪个命令,取出图的方式,是否用tiff ,还是自带的出图方式。我个人感觉tiff出来的图清晰度还是要高一些的啊,但我更倾向于直接用Rstudio的粘贴复制。
因为tiff文件没法上传到该博客,也就没法比较图片的清晰度,这里就省略了
命令1:(修改大小)
library(grid);
ggplot(agcd,aes(seqs,value))+geom_point()+aes(shape=bq) +scale_shape_manual(values=c(1,19,3,6))
+theme(panel.background=element_blank(),panel.grid.minor=element_blank(),
axis.line=element_line(size=0.5),legend.title=element_blank())  +theme(legend.key.size=unit(2,'cm'),legend.text = element_text(size = 10,
hjust   = 3, vjust = 3, face = 'bold'))
+theme(axis.text.x=element_text(size=15,colour="black"),
axis.text.y=element_text(size=15,colour="black"))
+xlab("序列数  Sequences quantity")+ylab("OTU个数  OTU quantity")
+theme(axis.title.x=element_text(size=15),axis.title.y=element_text(size=15));
通过命令1,我发现生成的tif图形有问题,如果是要加tif命令来生成图形的话,就不应该修改图上各个参数的大小值,否则生成的图片就会有问题,如果不是用tiff来生成图形的话,就需要加入各个参数合适的大小值。
命令2:(不修改大小)
tiff(filename = "稀释性曲线2.tif",width = 15,height = 12,units ="cm",compression="lzw",bg="white",res=600);
ggplot(agcd,aes(seqs,value))+geom_point()+aes(shape=bq) +scale_shape_manual(values=c(1,19,3,6))
+theme(panel.background=element_blank(),panel.grid.minor=element_blank(),
axis.line=element_line(size=0.5),legend.title=element_blank())
+theme(axis.text.x=element_text(colour="black"),
axis.text.y=element_text(colour="black"))
+xlab("序列数  Sequences quantity")+ylab("OTU个数  OTU quantity");
dev.off()
命令2,生成图片以后,点击copy to clipboard,调整合适的大小,然后选择copy as的类型(bitmap,metafile), 确认后,然后就可以将图片粘贴到你想要他到的地方了,得到的是矢量图,(这个我更喜欢,但是生成的是适用于word的矢量图,我在word中另存后,反而不清晰了,如下图)
二、例二
x=c(6,1,4,5,5,1)
y=c(1,5,4,2,6,6)
xy =c ("XX","YY","XY","XX","XY","YY")
xyz =c ("1","1","1","2","XY","YY")
aa<- data.frame(a=x,b=y,c=xy,d=xyz)

ggplot(aa,aes(aa$a,aa$b))+geom_point(aes(color=factor(c),size=2,shape=factor(d)))
+scale_color_manual(values = c("red","blue","green"))+xlab("Allele X:A (snpTye-FAM)")
+ylab("Allele Y:G(SNPType-HEX")+labs(title="rs1234")
+theme(axis.title.x=element_text(size=15,color="red"),title =element_text(size=20),
axis.title.y = element_text(size=15,color ="green"),axis.text.x= element_text(size=15),
axis.text.y= element_text(size=15),legend.position = 'none',axis.line = element_line(size =0.5),
panel.border= element_blank(),panel.background=element_rect(fill="white"),
plot.background=element_rect(fill ="grey",colour="grey"))+scale_y_continuous(breaks =c(0,1,2,3,4,5,7),
limits=c(0,8))+scale_x_continuous(breaks =c(0,1,2,3,4,5),
limits=c(0,7)) +theme(panel.grid.major = element_line(size=0.5,color="grey",linetype='dashed'),
panel.grid.minor=element_blank())+geom_text(aes(x=1,y=1,label="CR"))
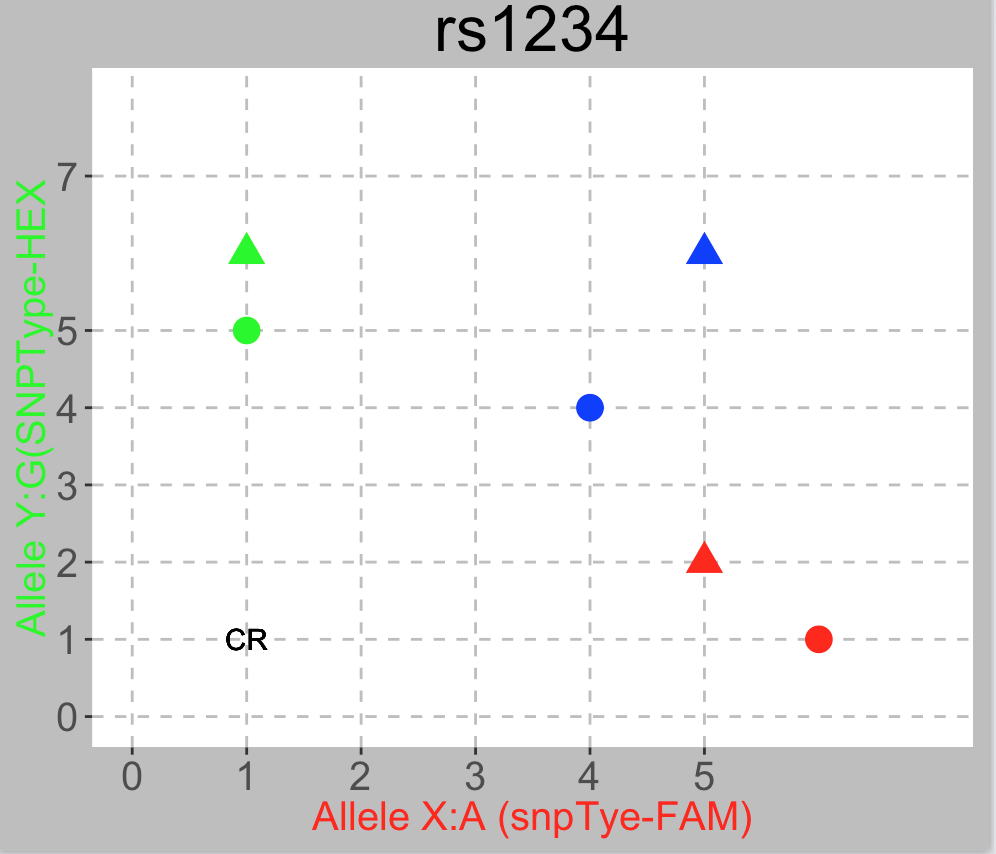
1.geom_point指定颜色
scale_color_manual(values = c("red","blue","green"))
这个颜色的的顺序跟factor(变量)对应的顺序对应哈
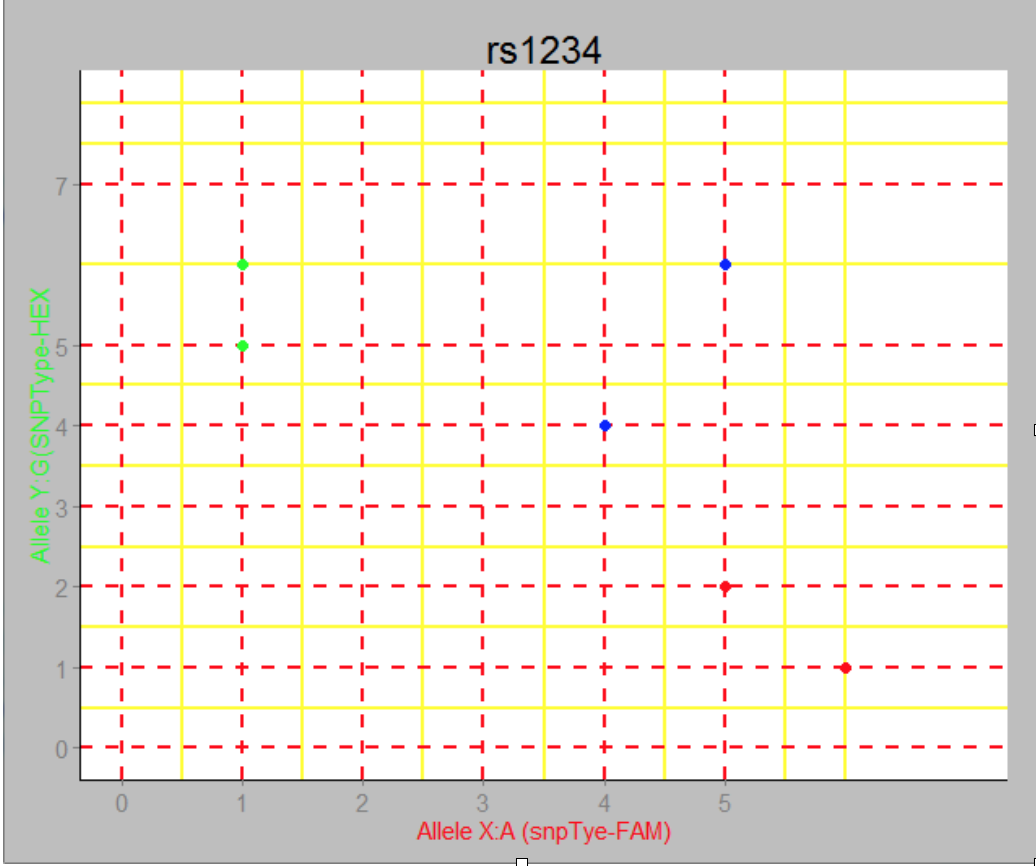
2.修改网格线
theme(panel.grid.major =
element_line(size=5,color="red"),panel.grid.minor=element_line(size=1,color="yellow",style))
	theme(panel.grid.major = element_line(size=1,color="red",linetype='dashed'),
panel.grid.minor=element_line(size=1,color="yellow",style))

panel.grid.major 坐标轴标刻对应的位置为主
panel.grid.minor 其他的为辅助
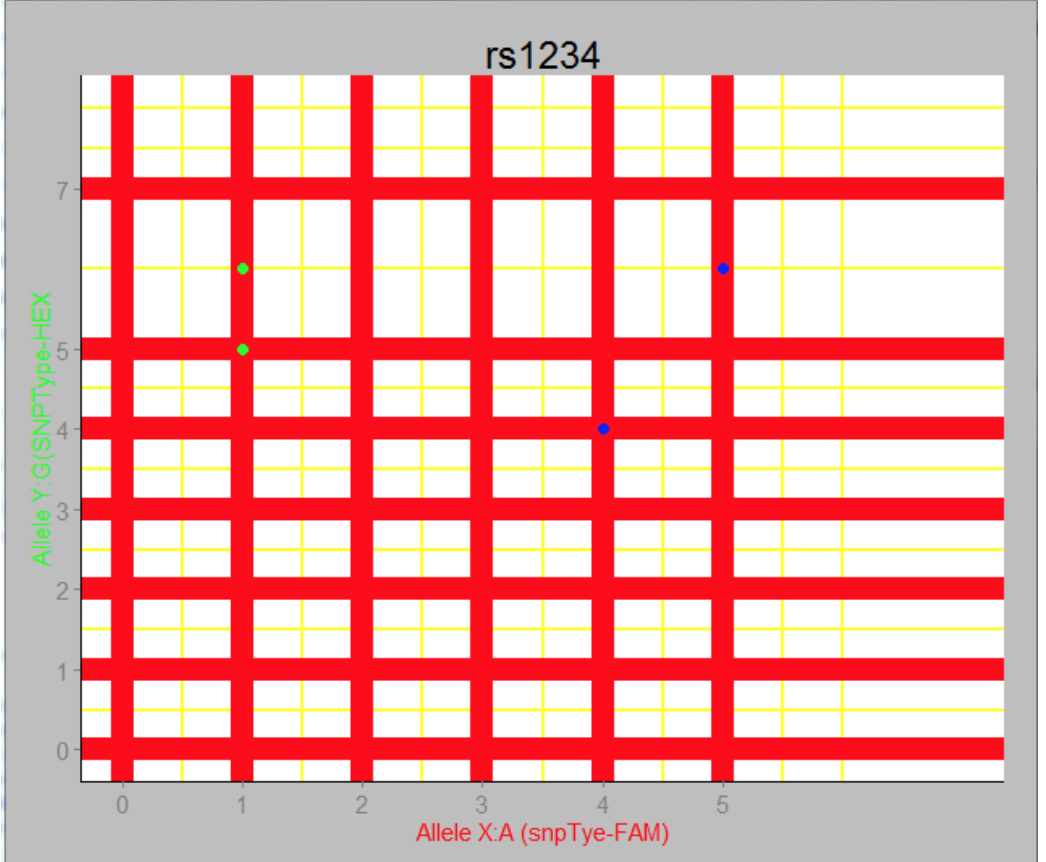
theme(panel.grid.major = element_line(size=1,color="red",linetype='dashed'),
panel.grid.minor=element_line(size=1,color="yellow",style))
3.修改背景色
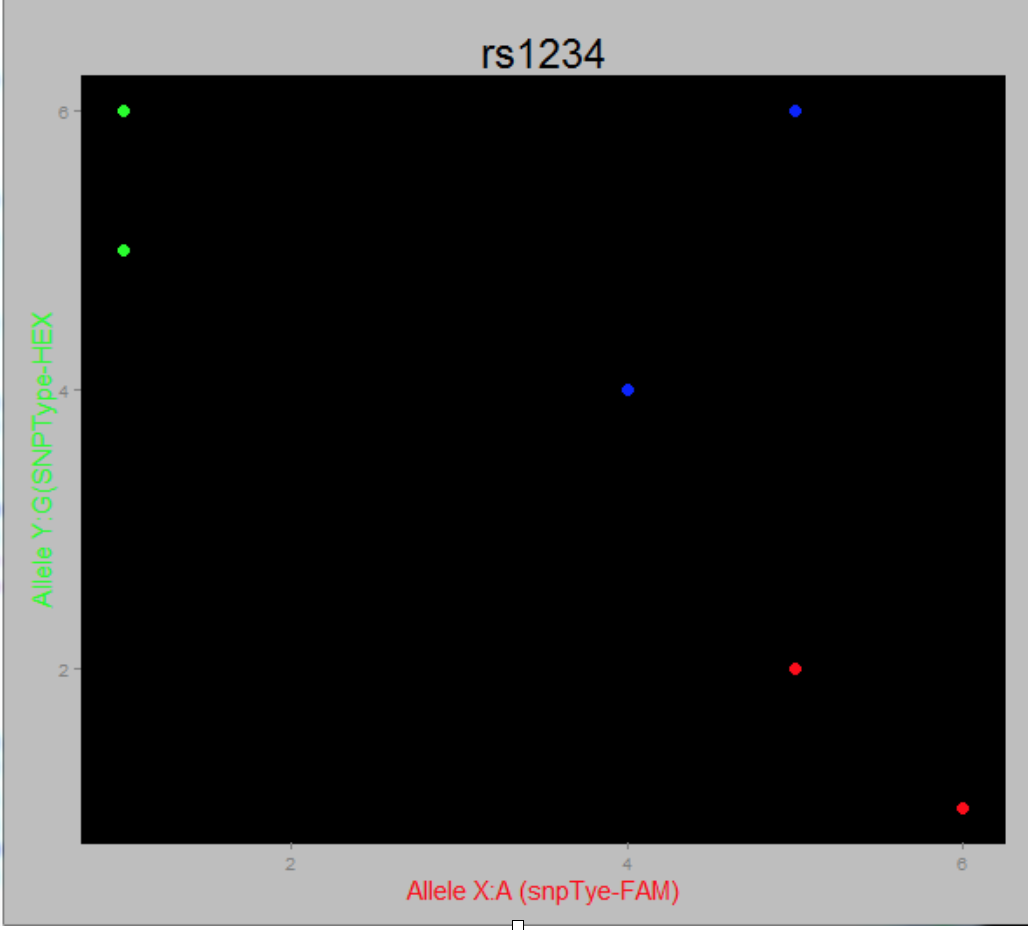
+theme(panel.background=element_rect(fill="black"),plot.background=element_rect(fill ='grey',colour='grey'))
To change the panel's background color, use the following code:
myplot + theme(panel.background = element_rect(fill = 'green', colour = 'red'))
To change the color of the plot (but not the color of the panel), you can do:
myplot + theme(plot.background = element_rect(fill = 'green', colour = 'red'))
panel.background 指画布的背景,plot.background指画布外边框的颜色
也可以panel.background=element_blank()消除背景色
4.加文字
+geom_text(aes(x=1,y=1,label="CR"))
5.去掉legend
legend.position = 'none'
修改图注以及对应的名字
scale_color_manual(values=c('grey','blue','red'),name = 'Consistent',labels=c('not in db','db_not_match','db_match'))
参考资料:
这里是一个广告位,,感兴趣的都可以发邮件聊聊:tiehan@sina.cn
![]() 个人公众号,比较懒,很少更新,可以在上面提问题,如果回复不及时,可发邮件给我: tiehan@sina.cn
个人公众号,比较懒,很少更新,可以在上面提问题,如果回复不及时,可发邮件给我: tiehan@sina.cn

