【3.4】ggplot-加注释annnoate
说明:
# Adding lines from a model can be simplified by using the function # predictvals():::: # Given a model, predict values of yvar from xvar This supports one # predictor and one predicted variable xrange: If NULL, determine the x # range from the model object. If a vector with two numbers, use those as # the min and max of the prediction range. samples: Number of samples # across the x range. ...: Further arguments to be passed to predict() predictvals <- function(model, xvar, yvar, xrange = NULL, samples = 100, ...) { # If xrange isn't passed in, determine xrange from the models. Different # ways of extracting the x range, depending on model type if (is.null(xrange)) { if (any(class(model) %in% c("lm", "glm"))) xrange <- range(model$model[[xvar]]) else if (any(class(model) %in% "loess")) xrange <- range(model$x) } newdata <- data.frame(x = seq(xrange[1], xrange[2], length.out = samples)) names(newdata) <- xvar newdata[[yvar]] <- predict(model, newdata = newdata, ...) newdata }

 library(gcookbook) # For the data set
library(ggplot2)
 model <- lm(heightIn ~ ageYear, heightweight)
 summary(model)
 pred <- predictvals(model, "ageYear", "heightIn")
 sp <- ggplot(heightweight, aes(x=ageYear, y=heightIn)) + geom_point() +
 geom_line(data=pred)
 sp + annotate("text", label="r^2=0.42", x=16.5, y=52)
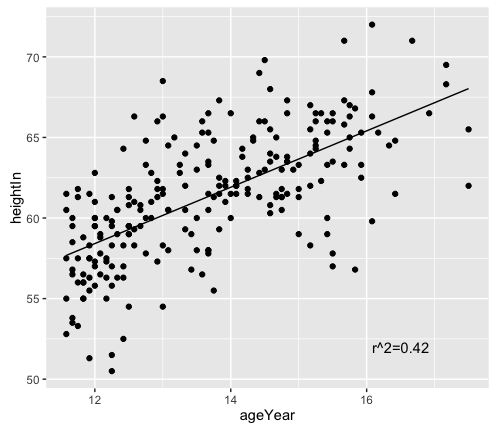
图上加注释有两种方式:annoate和geom_text()
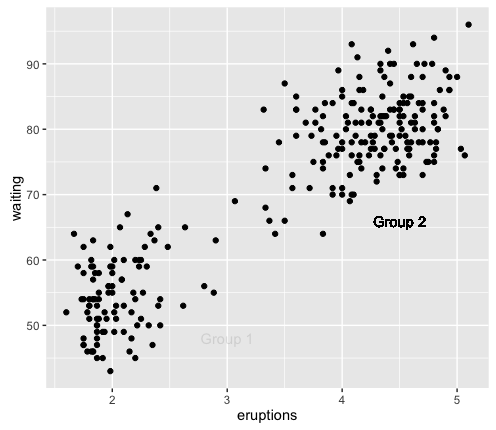
p <- ggplot(faithful, aes(x=eruptions, y=waiting)) + geom_point()
 p + annotate("text", x=3, y=48, label="Group 1") +
 annotate("text", x=4.5, y=66, label="Group 2")
#If you use geom_text(), the text will be heavily overplotted on the same location, with one copy per data point:
p + annotate("text", x=3, y=48, label="Group 1", alpha=.1) + # Normal
 geom_text(x=4.5, y=66, label="Group 2", alpha=.1) # Overplotted
加数学语言
 # A normal curve
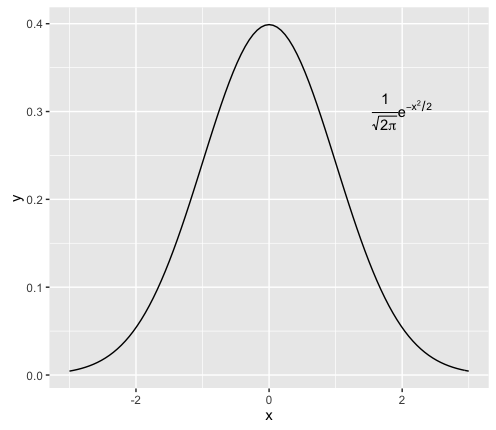
 p <- ggplot(data.frame(x=c(-3,3)), aes(x=x)) + stat_function(fun = dnorm)
 p + annotate("text", x=2, y=0.3, parse=TRUE,
 label="frac(1, sqrt(2 * pi)) * e ^ {-x^2 / 2}")
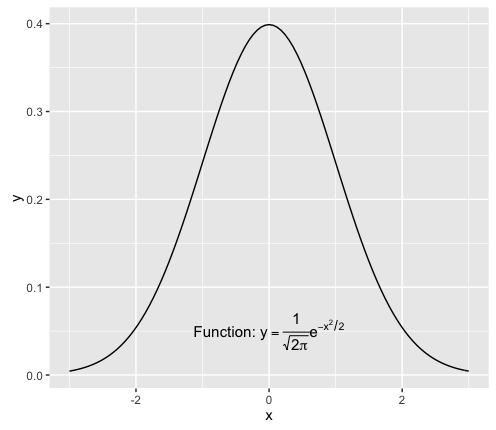
两个变量挨着的时候,加*
 p + annotate("text", x=0, y=0.05, parse=TRUE, size=4,
 label="'Function: ' * y==frac(1, sqrt(2*pi)) * e^{-x^2/2}")
加线(geom_hline,geom_vline,geom_abline)
 library(gcookbook) # For the data set
 p <- ggplot(heightweight, aes(x=ageYear, y=heightIn, colour=sex)) + geom_point()
 # Add horizontal and vertical lines
 p + geom_hline(yintercept=60) + geom_vline(xintercept=14)
 # Add angled line
 p + geom_abline(intercept=37.4, slope=1.75)
#slope为斜率,intercept位坐标轴焦点
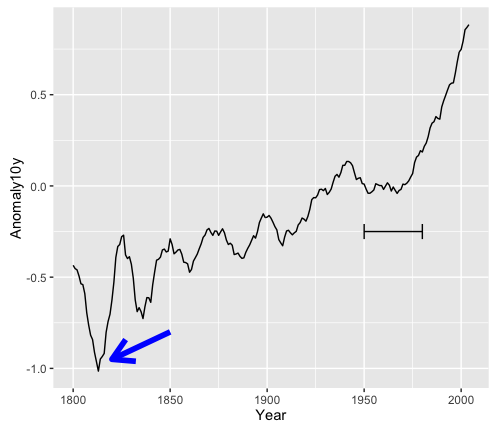
加箭头segment
 library(gcookbook) # For the data set
 p <- ggplot(subset(climate, Source=="Berkeley"), aes(x=Year, y=Anomaly10y)) +
 geom_line()
 p + annotate("segment", x=1950, xend=1980, y=-.25, yend=-.25)
 library(grid)
 p + annotate("segment", x=1850, xend=1820, y=-.8, yend=-.95, colour="blue",
 size=2, arrow=arrow()) +
 annotate("segment", x=1950, xend=1980, y=-.25, yend=-.25,
 arrow=arrow(ends="both", angle=90, length=unit(.2,"cm")))
 ### 加背景
 library(gcookbook) # For the data set
 p <- ggplot(subset(climate, Source=="Berkeley"), aes(x=Year, y=Anomaly10y)) +geom_line()
 p + annotate("rect", xmin=1950, xmax=1980, ymin=-1, ymax=1, alpha=.1,fill="blue")
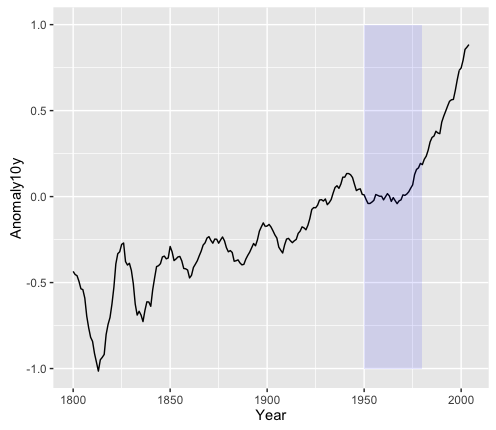
ggplot是基于图层的原理来作图的,想让谁在图的最上层,就最后加上对应的作图命令
参考资料:
R Graphics Cookbook by Winston Chang (O’Reilly)
这里是一个广告位,,感兴趣的都可以发邮件聊聊:tiehan@sina.cn
![]() 个人公众号,比较懒,很少更新,可以在上面提问题,如果回复不及时,可发邮件给我: tiehan@sina.cn
个人公众号,比较懒,很少更新,可以在上面提问题,如果回复不及时,可发邮件给我: tiehan@sina.cn

