【1】初识ggplot2
一、认知ggplot2
ggplot是基于图层这个样的一个理念,简单来说,一张统计图形包括如下的5个属性
- 几何对象(geometric object, 缩写位geom,包括点、线、大小等)
- 图形属性(aesthetic attributes,缩写为aes,包括颜色、形状、大小等)
- 数据的统计变换(statistical transformation,缩写位stats)
- 某个特定得坐标系(coordinate system,缩写位coord)中
- 分面(facet,指定绘图窗口划分为若干个子窗口)则可以用来生成数据不同子集的图形。
统计之都的讨论 http://cos.name/cn/topic/110682 有问题: 发邮件 Hadley@rice.eduggplot的谷歌论坛 https://groups.google.com/forum/#!forum/ggplot2
二、实例
画图实际上是把数据中的变量映射到图形属性上。以克拉(carat)数为X轴变量,价格(price)为Y轴变量。
以下面的这个数据集small为例。
carat cut color clarity depth table price x y z
49345 0.71 Very Good H SI1 62.5 60 2096 5.68 5.75 3.57
50545 0.79 Premium H SI1 61.8 59 2275 5.97 5.91 3.67
15434 1.03 IdealF SI1 62.4 57 6178 6.48 6.44 4.03
44792 0.50 Ideal E VS2 62.2 54 1624 5.08 5.11 3.17
34614 0.27 Ideal E VS1 61.6 56 470 4.14 4.17 2.56
27998 0.30 Premium E VS2 61.7 58 658 4.32 4.34 2.67

library("ggplot2")
set.seed(1410)
small<-diamonds[sample(nrow(diamonds),100),]
p <- ggplot(data = small, mapping = aes(x = carat, y = price))
上面这行代码把数据映射XY坐标轴上,需要告诉ggplot2,这些数据要映射成什么样的几何对象
1.散点图:
p + geom_point()

如果想将切工(cut)映射到形状属性
p <- ggplot(data= small, mapping = aes(x = carat, y = price, shape = cut));
p + geom_point();

再比如我想将钻石的颜色(color)映射颜色属性:
	p <-ggplot(data=small,mapping=aes(x=carat,y= price,shape=cut,colour=color));
p+geom_point();
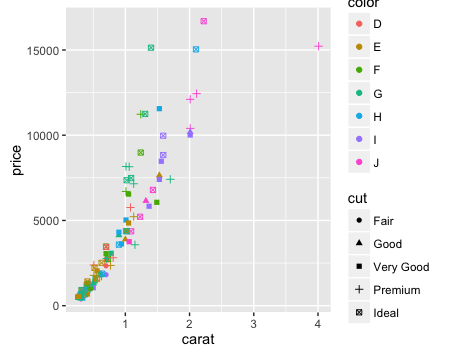
geom_point()完成的就是几何对象的映射,ggplot2提供了各种几何对象映射,如geom_histogram用于直方图,geom_bar用于画柱状图,geom_boxplot用于画箱式图等等。
2.直方图
提供一个x变量,画出数据的分布。
ggplot(small) + geom_histogram(aes(x = price))
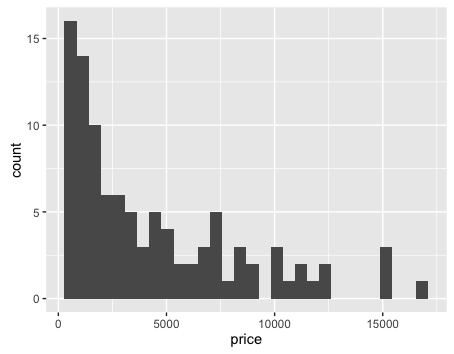
binwidth 默认的是30,可以用binwidth=x来设定数据分成几块来画
同样可以根据另外的变量给它填充颜色,比如按不同的切工:
ggplot(small) + geom_histogram(aes(x = price, fill = cut))
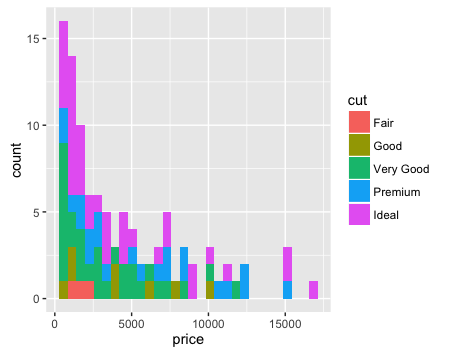
也可以将颜色分开来画,side-by-side地画直方图。
ggplot(small) + geom_histogram(aes(x = price, fill = cut), position = "dodge")
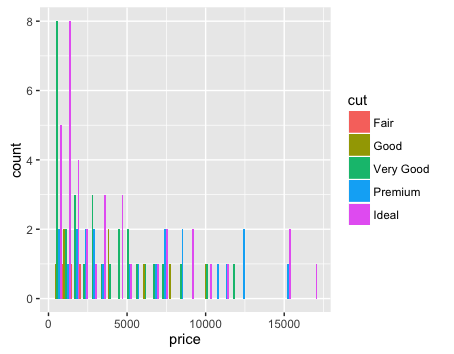
还可以使用position=“fill",按照相对比例来画。
ggplot(small) + geom_histogram(aes(x = price, fill = cut), position = "fill")
ggplot(ds) + geom_histogram(aes(x = coverage),binwidth=10)
3.柱状图
柱状图非常适合于画分类变量。在这里以透明度(clarity)变量为例。按照不同透明度的钻石的数目画柱状图。
ggplot(small) + geom_bar(aes(x = clarity))

柱状图两个要素,一个是分类变量,一个是数目,也就是柱子的高度。数目在这里不用提供,因为ggplot2会通过x变量计算各个分类的数目。
当然你想提供也是可以的,通过stat参数,可以让geom_bar按指定高度画图,比如以下代码:
ggplot()+geom_bar(aes(x=c(LETTERS[1:3]),y=1:3), stat="identity")
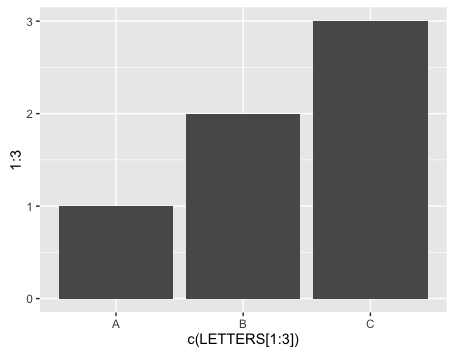
柱状图和直方图是很像的,直方图把连续型的数据按照一个个等长的分区(bin)来切分,然后计数,画柱状图。而柱状图是分类数据,按类别计数。我们可以用前面直方图的参数来画side-by-side的柱状图,填充颜色或者按比例画图,它们是高度一致的。
colour参数指定的是曲线的颜色,而fill是往曲线下面填充颜色。
ggplot(small) + geom_density(aes(x = price, fill = clarity))

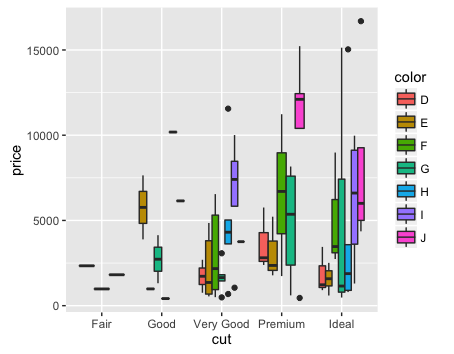
4.箱式图
ggplot(small) + geom_boxplot(aes(x = cut, y = price, fill = color))
5.标尺(Scale)
前面我们已经看到了,画图就是在做映射,不管是映射到不同的几何对象上,还是映射各种图形属性。这一小节介绍标尺,在对图形属性进行映射之后,使用标尺可以控制这些属性的显示方式,比如坐标刻度,可能通过标尺,将 坐标进行对数变换;比如颜色属性,也可以通过标尺,进行改变。
ggplot(small) + geom_point(aes(x = carat, y = price, shape = cut, colour = color))
+ scale_y_log10() + scale_colour_manual(values = rainbow(7))

ggplot(ds, aes(y = coverage, x = gc, color = gc, size = length))
	+scale_x_log10(limits=c(5,10000)) +scale_y_log10(limits=c(1,100))
	+xlab("Coverage") +ylab("gc") +geom_point(alpha = 0.5)
	+scale_size_area(name= "Scaffold length",max_size=20)
	+scale_colour_gradientn(colours=c('red','green','blue'))
颜色,大小和形状是图形属性,这个工具能够使数据取值与图形属性产生对应关系
三、python中调用R
python也有一个ggplot的包 https://github.com/yhat/ggplot/tree/master/docs
TypeError: 'int' object is not iterable
geom_point(aes(color=factor(c),size=2,shape=factor(d)))
中的size需要加引号

axis.text.x= element_text(size=15)
需要改成
theme(axis_title_x = element_text(size=15, color="red"))
将.换成_
python中的ggplot用起来太麻烦了 还不如直接用Python调用写好的ggplot脚本呢,然后传参数进去
参考资料:
《ggplot2:数据分析与图形艺术》这本书用来存储错误的地方以及该书的代码https://github.com/cosname/ggplot2-translation
代码下载地址:https://github.com/cosname/ggplot2-translation/archive/master.zip
http://ygc.name/2014/05/11/use-ggplot2/(这个网页很强大,具体用法还可以还是看他的)
http://blog.sina.com.cn/s/blog_77b74e97010194mw.html
http://yulongniu.bionutshell.org/blog/2012/08/21/python-r-rpy2/
http://rpy.sourceforge.net/rpy2/doc-2.2/html/introduction.html
