【2.3】R中的颜色
今天跟室友谈到“如何成为一个有品味的码农”,那必不可少得就是设计罗,谈到设计,就少不了要搞搞颜色了嘛
一、颜色概论
计算机保存及还原颜色时有多种方案,较为常用的是RGB和HSV。简单说一下HSV,模型中颜色的参数分别是:色调(H,Hue),饱和度(S,Saturation),亮度(V,Value), 是根据颜色的直观特性由A. R. Smith在1978年创建的一种颜色空间, 也称六角锥体模(Hexcone Model)。
二、grDevices
R预设了657种颜色。默认情况下,R中颜色的设置主要需要依靠grDevices包的支持,其中提供了大量的颜色选择函数以及生成函数,以及几种预先设置好的调色板(Palette),用以表现不同的主题。我们把grDevices包中所有关于颜色的函数大致分为三类:
- 固定颜色选择函数
- 颜色生成和转换函数
- 特定颜色主题调色板
**固定颜色选择函数:**固定颜色选择函数也就是R提供的它自带固定种类的颜色,主要是函数colors()(或者英式拼写colours())以及palette()。
下面的代码将会随机抽取产生15种颜色
> sample(colors(), 15)
[1] "darkgrey" "grey75" "gray61" "slateblue1" "lightgrey"
[6] "hotpink2" "darkolivegreen" "darkseagreen2" "mediumpurple4" "lightsteelblue4"
[11] "cyan"
再比如常见的红,绿,蓝:
colors()[c(552,254,26)]
[1] "red" "green" "blue"
由于R提供的颜色巨多,我们可以使用grep()来提取我们感兴趣的颜色。如下
colors()[grep("red",colors())]
colors()[grep("sky",colors())]
如果需要,想要一目R提供的颜色,你可以运行下面的代码,一窥究竟:
pdf("C:/colors-bar.pdf", height = 120)#打开一个pdf绘图设备,注意目录切换符号
par(mar = c(0, 10, 3, 0) + 0.1, yaxs = "i")
barplot(rep(1, length(colors())), col = rev(colors()),names.arg = rev(colors()), horiz = TRUE, las = 1,
xaxt = "n", main = expression_r("Bars of colors in" ~italic(colors())))
dev.off()
**palette() 调色板函数 **用法palette(value),这个函数用来设置调色板或者获得调色板颜色值;注意,实际上这个函数的结果可能并非“固定”颜色,但是只要设定好了调色板,它的取值就不会再改变(直到下一次重新设定调色板)。
palette()#查看默认的调色板颜色
> palette()
[1] "black" "red" "green3" "blue" "cyan" "magenta" "yellow" "gray"
此刻的调色板
>palette(colors()[1:10])#修改调色板的值
>palette()
[1] "white" "aliceblue" "antiquewhite" "antiquewhite1" "antiquewhite2"
	[6] "antiquewhite3" "antiquewhite4" "aquamarine" "aquamarine" "aquamarine2"
	>palette("default")#恢复调色板
**颜色生成和转换函数:**R提供了一系列利用颜色生成原理如
- RGB模型(红绿蓝三原色混合)
- HSV色彩模型(色调、饱和度和纯度)
- HCL色彩模型(色调、色度和亮度)和灰色生成模型等构造的颜色。
**rgb():**红、绿、蓝三原色混合,用法rgb(red, green, blue, alpha, names= NULL, maxColorValue = 1),其中前四个参数都取值于区间[0,maxColorValue],names参数用来指定生颜色向量的名称。这里前三个参数不用过多解释,值越大就说明那种颜色的成分越高;可能alpha我们不太熟悉,它指的是颜色的透明度,取0表示完全透明,取最大值表示完全不透明(默认),透明度在统计图形中有着重要地位,因为它具有一个非常有用的性质—透明度可以叠加,即:两个或多个带有透明色的图形元素重叠在一起时,重叠部分的透明度会变小;这在某些统计图形中可以找到很好的应用,例如当散点图中点的数目过多而导致大量的点相互重叠时,我们可以使用透明色来看清图中的深层规律,其中一个直接的规律就是二维密度,点重叠越密集,则颜色越深(由于透明度的的叠加),该处的密度值也越大。
hsv() 用色调(Hue)、饱和度(Saturation)和纯度(Value)来构造颜色,用法hsv(h = 1, s = 1, v = 1, gamma = 1, alpha),前三个参数分别对应色调、饱和度和纯度,取值于区间[0, 1],参数gamma表示伽玛校正3(Gamma Correction);alpha意思同上,但取值在区间[0,1]上。
gray()或grey():只有一个参数level,表示灰度水平,取值在0到1之间,其中0表示纯黑色,而表示纯白色;level取一个向量则可以生成一系列灰色值。
**hcl() **用色调(Hue)、色度(Chroma)和亮度(Luminance)构造颜色,用法为hcl(h = 0, c = 35, l = 85, alpha, fixup = TRUE);参数 h取值在区间[0, 360]上,可以将它想象为一个角度:0 表示红色,120 表示绿色,240 表示蓝色,中间的都是过渡色;参数c取值受h和l限制;参数l取值在区间[0, 100]上,取值越大生成的颜色越亮;alpha意思同hsv(); xup表示是否修正生成的颜色值,之所以要修正,是因为有些搭配生成的RGB颜色(r, g, b)可能出现一个元素超过1的情形。

另外还有rgb2hsv()、col2rgb()。

gray(seq(0, 1, length = 5))
(rgb.mat = matrix(c(255, 0, 0, 0, 255, 0, 0, 0, 255,10, 100, 200), nrow = 3))
rgb2hsv(rgb.mat)


col2rgb(
col2rgb("yellow"

col2rgb("#FF00FF")
**特定颜色主题调色板:**对于大多数理工出身的人来讲,理解颜色并不难,难的是如何选择一种或多种理想的颜色,让绘图很漂亮。颜色生成过程对于一般人来说也许显得太复杂,除了美术和绘图专,大部分人可能并不懂颜色的透明度、饱和度等概念,那么在配制大批量颜色的时候可能会比较迷惑。此时,R提供了第三种选择,那就是特定颜色主题的调色板。这些调色板都用一系列渐变的颜色表现了特定的主题,例如彩虹颜色系列、白热化颜色系列、地形颜色系列等等。几个基础包基带的调色板函数如下:
rainbow():顾名思义,就是用彩虹的颜色(“红橙黄绿青蓝紫”)来产生一系列颜色,用法rainbow(n, s = 1, v = 1, start = 0, end= max(1, n - 1)/n, gamma = 1);参数n设定产生颜色的数目,参数s、v和gamma前文已经解释过;参数start和end设定彩虹颜色的一个子集,生成的颜色将从这个子中选取,这个子集选取的大致分界线为:红色(red)为0,黄色(yellow)为1/6,绿色(gr een)为2/6,青色(cyan)为3/6,蓝色(blue)为4/6,红紫色(magenta)为5/6。
heat.colors() 从红色渐变到黄色再变到白色(以体现“高温”、“白热化”)。
terrain.colors() 从绿色渐变到黄色再到棕色最后到白色(这些颜色适合表示地理地形)。

cm.colors() 从青色渐变到白色再到粉红色。

topo.colors() 从蓝色渐变到青色再到黄色最后到棕色。
rainbow(n, s = 1, v = 1, start = 0, end = max(1, n - 1)/n, alpha = 1)
heat.colors(n, alpha = 1)
terrain.colors(n, alpha = 1)
topo.colors(n, alpha = 1)
cm.colors(n, alpha = 1)
n代表这个调色板里面有几种颜 alpha介于【0,1】,反映的是透明度
s, v the ‘saturation’ and ‘value’ to be used to complete the HSV color descriptions.
start the (corrected) hue in [0,1] at which the rainbow begins.
end the (corrected) hue in [0,1] at which the rainbow ends.## 二、RColorBrewer
RColorBrewer是一个R颜色包,使用 http://colorbrewer2.org/ 这个网站提供的颜色。我们画一个包括八个box的boxplot时,或者在xy散点图上画六条线时,该怎样选择颜色呢?这个包就可以帮你。
这个包提供了三类调色板,用户只需要指定调色板名称,就可以用包中的brewer.pal()函
数生成颜色。这三类调色板包括:

连续型调色板Sequential palettes,生成一系列连续渐变的颜色,通常用来标记连续型数值的大小极端化调色板Diverging
palettes,生成用深色强调两端、浅色标示中部的系列颜色,可用来标记数据中的离群点

离散型调色板Qualitative palettes,生成一系列彼此差异比较明显的颜色,通常用来标记分类数据

======**=哪些颜色系可以使用?**=======
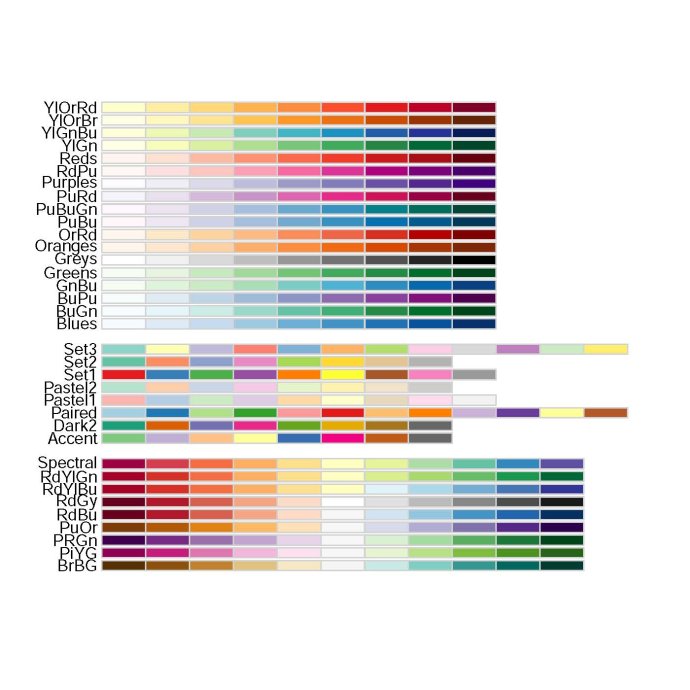
让我们先看看RColorBrewer给我们提供了哪些颜色系。
将如下代码写进test.R并运 行。(运行方式:R CMD BATCH test.R)
### Load the package or install if not present


if (!require("RColorBrewer")) {	install.packages("RColorBrewer")
library(RColorBrewer
}
Set the display a 1 by 1 grid
par(mfrow=c(1,1))
#比如mfrow(2,3)就是指将绘图区域分成2行3列,并按行的顺序依次绘图填充;

### Show all the colou
r schemes available
display.brewer.all()
运行后生成的Rplots.pdf显示如下:

共有三组颜色可供使用: Sequential,按顺序渐变的。 - Light colours for low data, dark for high data
Diverging,彼此之间差异变化较大的。 - Light colours for mid-range data, low and high contrasting dark colours
Qualitative,这个用于最大程度地显示不同类之间的差别。 - Colours designed to give maximum visual difference between classe =======如何使用RColorBrewer?======
还是举例说明。运行如下代码。
Load the package or install if not present if (!require(“RColorBrewer”)) {
install.packages("RColorBrewer")
library(RColorBrewer)
}
### Set the display a 1 by 1 grid
par(mfrow=c(1,1))
### Generate random data matrix
rand.data <- replicate(8,rnorm(100,100,sd=1.5))
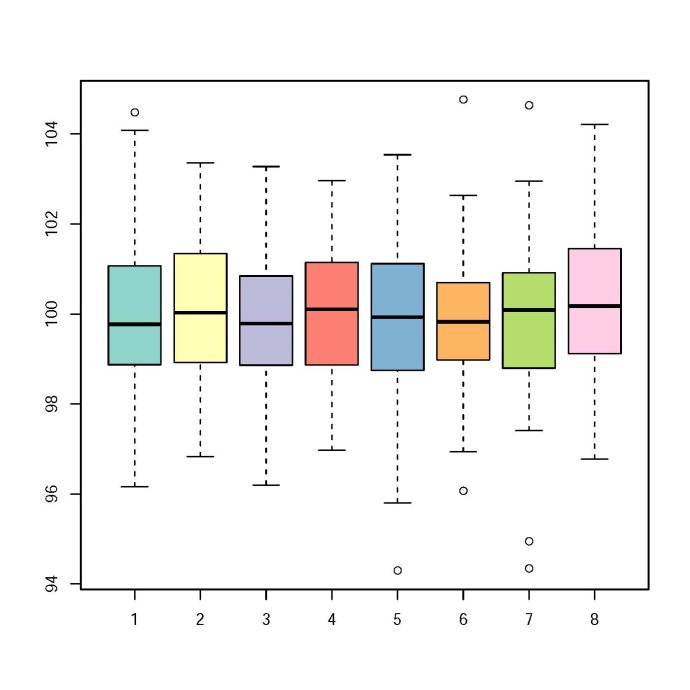
### Draw a box plot, with each box coloured by the 'Set3' palette
boxplot(rand.data,col=brewer.pal(8,"Set3"))
结果如下:

我们生成了8组随机数,然后作boxplot.
col=brewer.pal(8,“Set3”)表示使用Set3的8种颜色。
=======其他画图函数中的使用======= 除了boxplot,其他的画图函数中也能使用RColorBrewer。
### Load the package or install if not present
if (!require("RColorBrewer")) {
install.packages("RColorBrewer")
library(RColorBrewer)
}
### Set the display a 2 by 1 grid
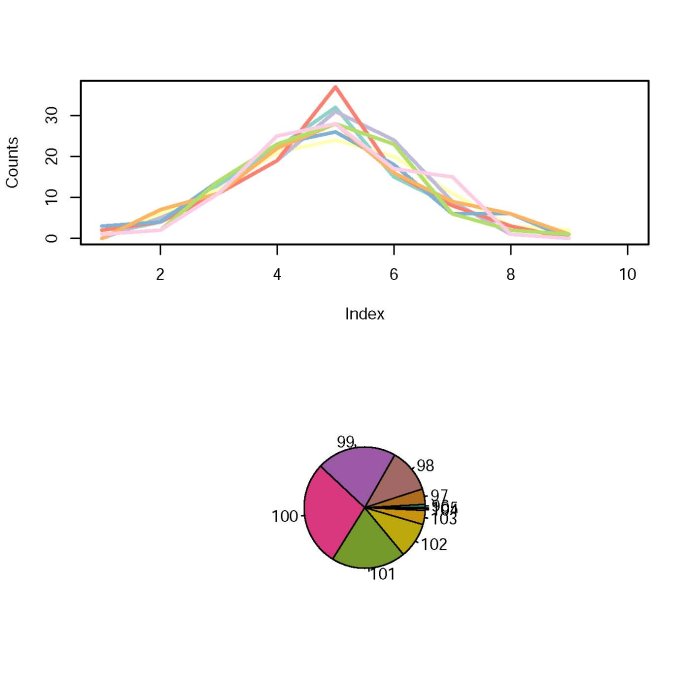
par(mfcol=c(2,1)) ### Generate random data matrix rand.data <- replicate(8,rnorm(100,100,sd=1.5)) ### Draw plot of counts coloured by the ‘Set3’ pallatte br.range <- seq(min(rand.data) ,max(rand.data),length.out=10) results <- sapply(1:ncol(rand.data),function(x) hist(rand.data[,x],plot=F,br=br.range)$counts) plot(x=br.range,ylim=range(results),type=“n”,ylab=“Counts”) cols <- brewer.pal(8,“Set3”) lapply(1:ncol(results),function(x) lines(results[,x],col=cols[x],lwd=3)) ### Draw a pie chart table.data <- table(round(rand.data)) cols <- colorRampPalette(brewer.pal(8,“Dark2”))(length(table.data)) pie(table.data,col=cols)
结果如下:

=======颜色不够用怎么办?=======
使用colorRampPalette可以扩展颜色。
if (!require("RColorBrewer")) {
install.packages("RColorBrewer")
library(RColorBrewer)
}

### Set the display a 1 by 1 grid
par(mfrow=c(1,1))
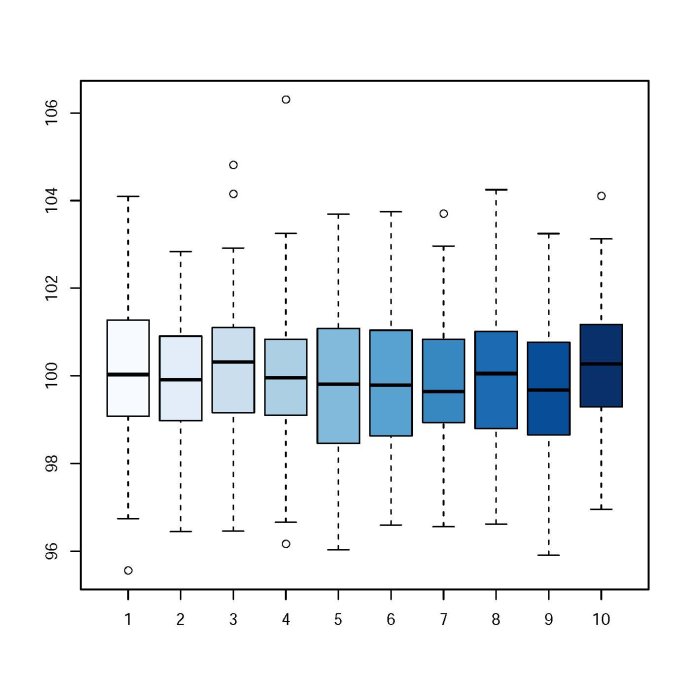
newpalette<-colorRampPalette(brewer.pal(9,"Blues"))(10)
### Generate random data matrix
rand.data
### Draw a box plot, with each box coloured by the 'newpalette' palette
boxplot(rand.data,col=newpalette)
运行结果如下:

colorRampPalette将Blues系列的第九个颜色进行了延伸,产生了10种渐变色。
我常用的两种方式
cols <-colorRampPalette(brewer.pal(9,"Blues"))(10)
圆括号指定有几个点或线用画颜色
cols <- brewer.pal(8,"Set3")[X]
[]指定调用其中的第几个颜色
其他
>library(RColorBrewer)
>display.brewer.all(
brewer.pal(9, "Blues")
(x = rgb(1, seq(0, 1, length = 30), 0))
display.brewer.all(type = "seq")# 连续型:18种
display.brewer.all(type = "div")# 极端化:9种
display.brewer.all(type = "qual")# 离散型:8种
xx = c(1912, 1912:1971, 1971)
yy = c(min(nhtemp), nhtemp, min(nhtemp))
plot(xx, yy, type = "n", xlab = "Year", ylab = "Temperatures")
for (i in seq(255, 0, -3)) {
yy = c(45, nhtemp - (nhtemp - min(nhtemp)) *
(1 - i/255), 45)
#rgb()中的绿色成分逐渐变小
polygon(xx, yy, col = rgb(1, i/255, 0), border = NA)
# Sys.sleep(0.05)
# 为了看清作图过程,可以让每步循环延迟0.05秒
}
box()
四、在绘图时,有如下颜色参数:
参数 描述
col 绘图使用的颜色,许多函数接受一组颜色,并对不同的数据依次使用颜色。
col.axis 坐标轴字符颜色
col.lab x,y坐标标记颜色
col.main 标题颜色
col.sub 副标题颜色
fg 绘图前景色,包括坐标轴,各类boxes
bg 绘图背景色
案例:
require(graphics)
par(col.axis="green",col.lab="blue",col.main="darkred",fg="white",bg="black")
plot(cars,main="speed vs dist")
六、讨论:
1.自定义调色板
rgb.c<- colorRampPalette(c('red','green','blue'));

rgb.a<-adjustcolor(rgb.c(max(d$gc)-min(d$gc)),alpha.f=0.2);

palette(rgb.a);
pairs(g1.s.B[,8:12], upper.panel=NULL, col = g1.s.B$gc-min(d$gc), cex = sqrt(g1.s.B$length)/100, pch=20)

##adjustcolor(col, alpha.f = 1, red.f = 1, green.f = 1, blue.f = 1, offset = c(0, 0, 0, 0),
##colorRamp(colors, bias = 1, space = c("rgb", "Lab"),
interpolate = c("linear", "spline"))
colorRampPalette(colors, ...)
2.ggplot2中应用的渐变色
ggplot(heightweight, aes(x=weightLb, y=heightIn, fill=ageYear)) +
		geom_point(shape=21, size=2.5) +
		scale_fill_gradient(low="black", high="white", breaks=12:17,
	guide=guide_legend())

library(gcookbook) # For the data set
# Base plot
p = ggplot(heightweight, aes(x=ageYear, y=heightIn, colour=weightLb)) +
	 geom_point(size=3)
p
# With a gradient between two colors
p + scale_colour_gradient(low="black", high="white")
# A gradient with a white midpoint
library(scales)
p + scale_colour_gradient2(low=muted("red"), mid="white", high=muted("blue"),
	midpoint=110)
# A gradient of n colors
p + scale_colour_gradientn(colours = c("darkred", "orange", "yellow", "white"))
3.ggplot不采用颜色做标志
有的杂志居然有要求文章里面的 图形能不用彩色,就不用。因此需要将之前做的彩色条形图替换成非颜色做标识的图(形状填充,或阴影)
这是ggplot2给的回复:
Greg Snow <538280@gmail.com> One possible reason for not implementing fill patterns is that they are really not recommended. They were originally used when the only way to produce high quality graphs was by hand or with a manual pen plotter (where trying to use a solid fill often resulted in holes in the paper). Tufte in his book discusses that many of the fill patterns can cause a Moire effect when looked at (this is an illusion of movement from still patterns with lots of parallel lines, especially when patterns have different angles).A probably better approach to moving away from color (many good reasons to do so) is instead to use a dot plot, you can use symbols or more direct labeling rather than worrying about colors or patterns. Dotplots also work better when you want to include error bars (the bars tend to distort barplots since the focus is on comparing lengths/widths and the added error bar fuzzies up that comparison, with dotplots you are comparing positions on an aligned scale which the bars interfere with much less).
Brandon Hurr
There was some discussion quite a few years ago about creating a pattern fill. I believe Baptiste or koshke had the beginnings of one, but it was never pursued further. If you need to publish in black and white consider using scale_fill_grey() for the bars. With two levels it will be very clear, but with more than 3 it will be less simple. Also, consider using geom_point() and geom_errorbar() instead of geom_dynamite_plot() [i.e. geom_bar()].
进一步查资料,发现barplot可以实现条形图填充
barplot里面调节density来表示线的稀疏,调节angle表示线的倾斜角度
eample(barplot)
> barplot(VADeaths, angle = 15+10*1:5, density = 20, col = "black",legend = rownames(VADeaths))
获得网格线
height <- t(t(c(1,-1,1)))
bardensity <- t(t(c(10,10,0)))
barangle <- t(t(c(45,135,0)))
barplot(height, density = bardensity, angle = barangle)
行不通的思路,问题出在那呢??
P<-barplot(height, density = bardensity, angle = barangle)
p2<-barplot(1, angle = 45, density = 10, col = "black")
scale_fill_manual(values=c(p1,p2))
最后采取的策略
scale_fill_manual(values=c("grey","black"))
或者
+scale_fill_grey()
出来的是黑色和灰色两种色度
注:刘师兄提到这种灰黑区分的话,有白,灰,深灰,黑 4中区分度,样品多了就不行罗。
参考资料:
一月光环 http://blog.163.com/wxh244295043@yeah/blog/static/1726580122012820961711(超赞)
87%完美的日子 http://blog.sina.com.cn/s/blog_681aaa5501016tk4.html
http://r.789695.n4.nabble.com/How-to-fill-bar-plot-with-textile-rather-than-color-td847003.html
http://cos.name/cn/topic/152482/
https://groups.google.com/forum/?fromgroups#!topic/ggplot2/02tN2B7j02Y
